Ford 2013 Annual Report Download - page 117
Download and view the complete annual report
Please find page 117 of the 2013 Ford annual report below. You can navigate through the pages in the report by either clicking on the pages listed below, or by using the keyword search tool below to find specific information within the annual report.-
 1
1 -
2
-
3
-
4
-
5
-
6
-
7
-
8
-
9
-
10
-
11
-
12
-
13
-
14
-
15
-
16
-
17
-
18
-
19
-
20
-
21
-
22
-
23
-
24
-
25
-
26
-
27
-
28
-
29
-
30
-
31
-
32
-
33
-
34
-
35
-
36
-
37
-
38
-
39
-
40
-
41
-
42
-
43
-
44
-
45
-
46
-
47
-
48
-
49
-
50
-
51
-
52
-
53
-
54
-
55
-
56
-
57
-
58
-
59
-
60
-
61
-
62
-
63
-
64
-
65
-
66
-
67
-
68
-
69
-
70
-
71
-
72
-
73
-
74
-
75
-
76
-
77
-
78
-
79
-
80
-
81
-
82
-
83
-
84
-
85
-
86
-
87
-
88
-
89
-
90
-
91
-
92
-
93
-
94
-
95
-
96
-
97
-
98
-
99
-
100
-
101
-
102
-
103
-
104
-
105
-
106
-
 107
107 -
 108
108 -
 109
109 -
 110
110 -
 111
111 -
 112
112 -
 113
113 -
 114
114 -
 115
115 -
 116
116 -
 117
117 -
 118
118 -
 119
119 -
 120
120 -
 121
121 -
 122
122 -
 123
123 -
 124
124 -
 125
125 -
 126
126 -
 127
127 -
128
-
129
-
130
-
131
-
132
-
133
-
134
-
135
-
136
-
137
-
138
-
139
-
140
-
141
-
142
-
143
-
144
-
145
-
146
-
147
-
148
-
149
-
150
-
151
-
152
 |
 |

Ford Motor Company | 2013 Annual Report 115
FORD MOTOR COMPANY AND SUBSIDIARIES
NOTES TO THE FINANCIAL STATEMENTS
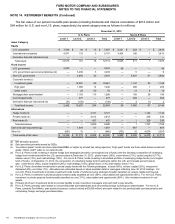
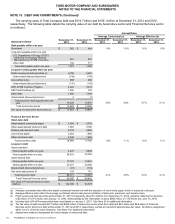
NOTE 15. DEBT AND COMMITMENTS (Continued)
The fair value of debt presented above reflects interest accrued but not yet paid. Interest accrued on Automotive debt
is reported in Automotive other liabilities and deferred revenue and was $195 million and $194 million at
December 31, 2013 and 2012, respectively. Interest accrued on Financial Services debt is reported in Financial Services
other liabilities and deferred income and was $633 million and $744 million at December 31, 2013 and 2012, respectively.
See Note 4 for fair value methodology.
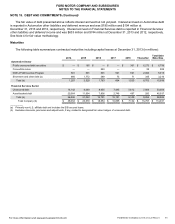
Maturities
The following table summarizes contractual maturities including capital leases at December 31, 2013 (in millions):
2014 2015 2016 2017 2018 Thereafter
Total Debt
Maturities
Automotive Sector
Public unsecured debt securities $ — $ 165 $ — $ — $ 361 $6,273 $ 6,799
Convertible notes — — 883 — — 25 908
DOE ATVM Incentive Program 591 591 591 591 591 2,060 5,015
Short-term and other debt (a) 666 1,772 289 73 71 345 3,216
Total (b) 1,257 2,528 1,763 664 1,023 8,703 15,938
Financial Services Sector
Unsecured debt 14,142 9,048 8,955 7,445 5,612 7,854 53,056
Asset-backed debt 22,664 11,994 7,836 2,746 497 200 45,937
Total (b) 36,806 21,042 16,791 10,191 6,109 8,054 98,993
Total Company (b) $ 38,063 $ 23,570 $18,554 $10,855 $7,132 $16,757 $114,931
__________
(a) Primarily non-U.S. affiliate debt and includes the EIB secured loans.
(b) Excludes discounts, premiums and adjustments, if any, related to designated fair value hedges of unsecured debt.
For more information visit www.annualreport.ford.com