Ford 2013 Annual Report Download - page 21
Download and view the complete annual report
Please find page 21 of the 2013 Ford annual report below. You can navigate through the pages in the report by either clicking on the pages listed below, or by using the keyword search tool below to find specific information within the annual report.-
 1
1 -
2
-
3
-
4
-
5
-
6
-
7
-
8
-
9
-
10
-
 11
11 -
 12
12 -
 13
13 -
 14
14 -
 15
15 -
 16
16 -
 17
17 -
 18
18 -
 19
19 -
 20
20 -
 21
21 -
 22
22 -
 23
23 -
 24
24 -
 25
25 -
 26
26 -
 27
27 -
 28
28 -
 29
29 -
 30
30 -
 31
31 -
32
-
33
-
34
-
35
-
36
-
37
-
38
-
39
-
40
-
41
-
42
-
43
-
44
-
45
-
46
-
47
-
48
-
49
-
50
-
51
-
52
-
53
-
54
-
55
-
56
-
57
-
58
-
59
-
60
-
61
-
62
-
63
-
64
-
65
-
66
-
67
-
68
-
69
-
70
-
71
-
72
-
73
-
74
-
75
-
76
-
77
-
78
-
79
-
80
-
81
-
82
-
83
-
84
-
85
-
86
-
87
-
88
-
89
-
90
-
91
-
92
-
93
-
94
-
95
-
96
-
97
-
98
-
99
-
100
-
101
-
102
-
103
-
104
-
105
-
106
-
107
-
108
-
109
-
110
-
111
-
112
-
113
-
114
-
115
-
116
-
117
-
118
-
119
-
120
-
121
-
122
-
123
-
124
-
125
-
126
-
127
-
128
-
129
-
130
-
131
-
132
-
133
-
134
-
135
-
136
-
137
-
138
-
139
-
140
-
141
-
142
-
143
-
144
-
145
-
146
-
147
-
148
-
149
-
150
-
151
-
152
 |
 |

Ford Motor Company | 2013 Annual Report 19
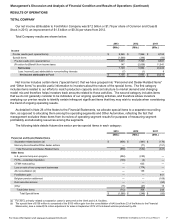
Management’s Discussion and Analysis of Financial Condition and Results of Operations (Continued)
AUTOMOTIVE SECTOR
In general, we measure year-over-year change in Automotive pre-tax operating profit for our total Automotive sector
and reportable segments using the causal factors listed below, with revenue and cost variances calculated at present-year
volume and mix and exchange:
• Market Factors:
Volume and Mix - Primarily measures profit variance from changes in wholesale volumes (at prior-year average
margin per unit) driven by changes in industry volume, market share, and dealer stocks, as well as the profit
variance resulting from changes in product mix, including mix among vehicle lines and mix of trim levels and
options within a vehicle line
Net Pricing - Primarily measures profit variance driven by changes in wholesale prices to dealers and marketing
incentive programs such as rebate programs, low-rate financing offers, and special lease offers
• Contribution Costs - Primarily measures profit variance driven by per-unit changes in cost categories that typically
vary with volume, such as material costs (including commodity and component costs), warranty expense, and freight
and duty costs
• Other Costs - Primarily measures profit variance driven by absolute change in cost categories that typically do not
have a directly proportionate relationship to production volume. These include mainly structural costs, described
below, as well as all other costs, which include items such as litigation costs and costs related to our after-market
parts, accessories, and service business. Structural costs include the following cost categories:
Manufacturing and Engineering - consists primarily of costs for hourly and salaried manufacturing- and
engineering-related personnel, plant overhead (such as utilities and taxes), new product launch expense,
prototype materials, and outside engineering services
Spending-Related - consists primarily of depreciation and amortization of our manufacturing and engineering
assets, but also includes asset retirements and operating leases
Advertising and Sales Promotions - includes costs for advertising, marketing programs, brand promotions,
customer mailings and promotional events, and auto shows
Administrative and Selling - includes primarily costs for salaried personnel and purchased services related to our
staff activities and selling functions, as well as associated information technology costs
Pension and OPEB - consists primarily of past service pension costs and other postretirement employee benefit
costs
• Exchange - Primarily measures profit variance driven by one or more of the following: (i) impact of gains or losses
arising from transactions denominated in currencies other than the functional currency of the locations, including
currency transactions, (ii) effect of remeasuring income, assets, and liabilities of foreign subsidiaries using U.S. dollars
as the functional currency, or (iii) results of our foreign currency hedging activities
• Net Interest and Other
Net Interest - Primarily measures profit variance driven by changes in our Automotive sector’s centrally-managed
net interest, which consists of interest expense, interest income, fair market value adjustments on our cash
equivalents and marketable securities portfolio, and other adjustments
Other - consists of fair market value adjustments to our investment in Mazda, as well as other items not included
in the causal factors defined above
For more information visit www.annualreport.ford.com