Ford 2013 Annual Report Download - page 111
Download and view the complete annual report
Please find page 111 of the 2013 Ford annual report below. You can navigate through the pages in the report by either clicking on the pages listed below, or by using the keyword search tool below to find specific information within the annual report.-
 1
1 -
2
-
3
-
4
-
5
-
6
-
7
-
8
-
9
-
10
-
11
-
12
-
13
-
14
-
15
-
16
-
17
-
18
-
19
-
20
-
21
-
22
-
23
-
24
-
25
-
26
-
27
-
28
-
29
-
30
-
31
-
32
-
33
-
34
-
35
-
36
-
37
-
38
-
39
-
40
-
41
-
42
-
43
-
44
-
45
-
46
-
47
-
48
-
49
-
50
-
51
-
52
-
53
-
54
-
55
-
56
-
57
-
58
-
59
-
60
-
61
-
62
-
63
-
64
-
65
-
66
-
67
-
68
-
69
-
70
-
71
-
72
-
73
-
74
-
75
-
76
-
77
-
78
-
79
-
80
-
81
-
82
-
83
-
84
-
85
-
86
-
87
-
88
-
89
-
90
-
91
-
92
-
93
-
94
-
95
-
96
-
97
-
98
-
99
-
100
-
 101
101 -
 102
102 -
 103
103 -
 104
104 -
 105
105 -
 106
106 -
 107
107 -
 108
108 -
 109
109 -
 110
110 -
 111
111 -
 112
112 -
 113
113 -
 114
114 -
 115
115 -
 116
116 -
 117
117 -
 118
118 -
 119
119 -
 120
120 -
 121
121 -
122
-
123
-
124
-
125
-
126
-
127
-
128
-
129
-
130
-
131
-
132
-
133
-
134
-
135
-
136
-
137
-
138
-
139
-
140
-
141
-
142
-
143
-
144
-
145
-
146
-
147
-
148
-
149
-
150
-
151
-
152
 |
 |

Ford Motor Company | 2013 Annual Report 109
FORD MOTOR COMPANY AND SUBSIDIARIES
NOTES TO THE FINANCIAL STATEMENTS
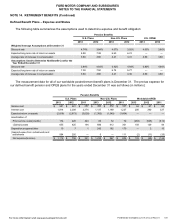
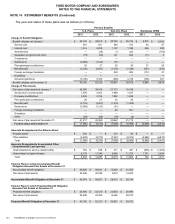
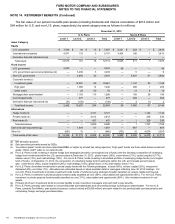
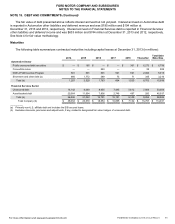
NOTE 14. RETIREMENT BENEFITS (Continued)
The fair value of our pension benefits plan assets (including dividends and interest receivables of $349 million and
$99 million for U.S. and non-U.S. plans, respectively) by asset category was as follows (in millions):
December 31, 2013
U.S. Plans Non-U.S. Plans
Level 1 Level 2 Level 3 Total Level 1 Level 2 Level 3 Total
Asset Category
Equity
U.S. companies $ 3,724 $22 $ 3 $ 3,749 $2,711 $229 $ — $ 2,940
International companies 2,288 76 12,365 2,983 214 2 3,199
Derivative financial instruments (a) — — — — — — — —
Total equity 6,012 98 46,114 5,694 443 2 6,139
Fixed Income
U.S. government 3,610 — — 3,610 30 — — 30
U.S. government-sponsored enterprises (b) — 4,127 —4,127 — 11 — 11
Non-U.S. government — 2,115 —2,115 —6,880 67 6,947
Corporate bonds (c)
Investment grade — 15,058 —15,058 —1,229 55 1,284
High yield — 1,254 —1,254 —337 21 358
Other credit — 48 — 48 — 37 13 50
Mortgage/other asset-backed — 1,287 33 1,320 —238 14 252
Commingled funds — 304 — 304 —471 —471
Derivative financial instruments (a) (23) 41 — 18 — (5) — (5)
Total fixed income 3,587 24,234 33 27,854 30 9,198 170 9,398
Alternatives
Hedge funds (d) — — 2,778 2,778 — — 1,657 1,657
Private equity (e) — — 2,626 2,626 — — 352 352
Real estate (f) — — 610 610 — — 601 601
Total alternatives — — 6,014 6,014 — — 2,610 2,610
Cash and cash equivalents (g) — 1,477 —1,477 —950 —950
Other (h) (273)30 1(242)(465) 13 5,198 4,746
Total assets at fair value $ 9,326 $25,839 $6,052 $41,217 $5,259 $10,604 $7,980 $ 23,843
_______
(a) Net derivative position.
(b) Debt securities primarily issued by U.S. government-sponsored enterprises (“GSEs”).
(c) “Investment grade” bonds are those rated Baa3/BBB- or higher by at least two rating agencies; “High yield” bonds are those rated below investment
grade; “Other credit” refers to non-rated bonds.
(d) For U.S. Plans, funds investing in diverse hedge fund strategies with the following composition of underlying hedge fund investments within the
U.S. pension plans at December 31, 2013: global macro (32%), event-driven (26%), equity long/short (22%), multi-strategy (11%) and relative
value (9%). For non-U.S. Plans, funds investing in diversified portfolio of underlying hedge funds. At December 31, 2013, the composition of
underlying hedge fund investments (within the U.K. and Canada pension plans) was: event-driven (35%), equity long/short (35%), multi-strategy
(12%), global macro (12%) and relative value (6%).
(e) For U.S. Plans, diversified investments in private equity funds with the following strategies: buyout (61%), venture capital (26%), mezzanine/
distressed (7%), and other (6%). Allocations are estimated based on latest available data for managers reflecting June 30, 2013 holdings. For non-
U.S. Plans, investments in private investment funds (funds of funds) pursuing strategies broadly classified as venture capital and buyouts.
(f) For investment in private property funds broadly classified as core (49%), value-added and opportunistic (51%). For non-U.S. Plans, investment in
private property funds broadly classified as core (40%), value-added and opportunistic (60%). Also includes investment in real assets.
(g) Primarily short-term investment funds to provide liquidity to plan investment managers and cash held to pay benefits.
(h) For U.S. Plans, primarily cash related to net pending security (purchases)/sales and net pending foreign currency purchases/(sales). For non-U.S.
Plans, primarily Ford-Werke, plan assets (insurance contract valued at $4,077 million) and cash related to net pending security (purchases)/sales
and net pending foreign currency purchases/(sales).
For more information visit www.annualreport.ford.com