Ford 2013 Annual Report Download - page 2
Download and view the complete annual report
Please find page 2 of the 2013 Ford annual report below. You can navigate through the pages in the report by either clicking on the pages listed below, or by using the keyword search tool below to find specific information within the annual report.-
 1
1 -
 2
2 -
 3
3 -
 4
4 -
 5
5 -
 6
6 -
 7
7 -
 8
8 -
 9
9 -
 10
10 -
 11
11 -
 12
12 -
 13
13 -
14
-
15
-
16
-
17
-
18
-
19
-
20
-
21
-
22
-
23
-
24
-
25
-
26
-
27
-
28
-
29
-
30
-
31
-
32
-
33
-
34
-
35
-
36
-
37
-
38
-
39
-
40
-
41
-
42
-
43
-
44
-
45
-
46
-
47
-
48
-
49
-
50
-
51
-
52
-
53
-
54
-
55
-
56
-
57
-
58
-
59
-
60
-
61
-
62
-
63
-
64
-
65
-
66
-
67
-
68
-
69
-
70
-
71
-
72
-
73
-
74
-
75
-
76
-
77
-
78
-
79
-
80
-
81
-
82
-
83
-
84
-
85
-
86
-
87
-
88
-
89
-
90
-
91
-
92
-
93
-
94
-
95
-
96
-
97
-
98
-
99
-
100
-
101
-
102
-
103
-
104
-
105
-
106
-
107
-
108
-
109
-
110
-
111
-
112
-
113
-
114
-
115
-
116
-
117
-
118
-
119
-
120
-
121
-
122
-
123
-
124
-
125
-
126
-
127
-
128
-
129
-
130
-
131
-
132
-
133
-
134
-
135
-
136
-
137
-
138
-
139
-
140
-
141
-
142
-
143
-
144
-
145
-
146
-
147
-
148
-
149
-
150
-
151
-
152
 |
 |

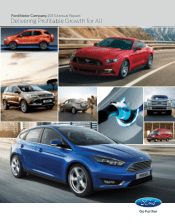
Ford Motor Company | 2013 Annual Report
Ford Motor Company created a framework for the development of vehicles
that customers truly want and value with its One Ford plan. The result is a full
lineup of cars, utilities and trucks that meet and exceed driver expectations
across global markets. Pictured on the front cover (clockwise from top left)
are: EcoSport, Mustang, all-new F-150, Transit, Focus, Kuga, C-MAX Hybrid with
hands-free liftgate and Fusion Energi Plug-In Hybrid. Pictured on the back cover
(clockwise from top left) are: Focus Electric, Fusion, Fiesta, Explorer, 1.0-liter
EcoBoost® engine, SmartGauge with EcoGuide, F-150 and SYNC® display screen.
.
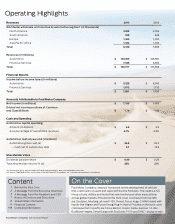
Revenues 2013 2012
Worldwide wholesale unit volumes by automotive segment (in thousands)
North America 3,088 2,784
South America 538 498
Eur op e 1,360 1,353
Asia Pacific Africa 1,344 1,033
Total 6,330 5,668
Revenues (in millions)
Automotive $ 139,369 $ 126,567
Financial Services 7,548 6,992
To tal $ 146,917 $ 133,559
Financial Results
Income before income taxes (in millions)
Automotive $ 5,329 $ 6,010
Financial Services 1,672 1,710
To tal $ 7,001 $ 7,72 0
Amounts Attributable to Ford Motor Company
Net income (in millions) $ 7,155 $ 5,665
Diluted net income per share of Common
and Class B Stock $ 1.76 $ 1.42
Cash and Spending
Automotive capital spending
Amount (in billions) $ 6.6 $ 5.5
As a percentage of Automotive revenues 4.7% 4.3%
Automotive cash at year end (in billions)
Automotive gross cash (a) $ 24.8 $ 24.3
– Cash net of Automotive debt 9.1 10.0
Shareholder Value
Dividends paid per share $ 0.40 $ 0.20
Total shareholder returns % (b) 22% 23%
Operating Highlights
Content
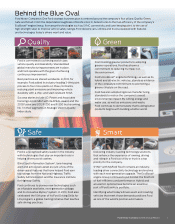
1 Behind the Blue Oval
2 A Message from the Executive Chairman
3 A Message from the President and CEO
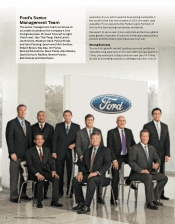
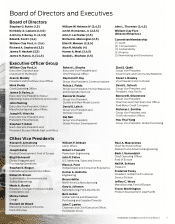
7 Board of Directors and Executives
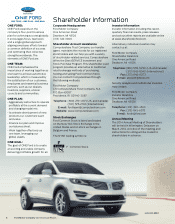
8 Shareholder Information
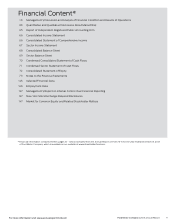
9 Financial Content
149 Company Information
(a) Automotive gross cash includes cash and cash equivalents and net marketable securities.
(b) Source: Standard & Poor’s, a division of the McGraw Hill Companies, Inc.; includes reinvestment of dividends.
On the Cover