Ford 2013 Annual Report Download - page 20
Download and view the complete annual report
Please find page 20 of the 2013 Ford annual report below. You can navigate through the pages in the report by either clicking on the pages listed below, or by using the keyword search tool below to find specific information within the annual report.-
 1
1 -
2
-
3
-
4
-
5
-
6
-
7
-
8
-
9
-
 10
10 -
 11
11 -
 12
12 -
 13
13 -
 14
14 -
 15
15 -
 16
16 -
 17
17 -
 18
18 -
 19
19 -
 20
20 -
 21
21 -
 22
22 -
 23
23 -
 24
24 -
 25
25 -
 26
26 -
 27
27 -
 28
28 -
 29
29 -
 30
30 -
31
-
32
-
33
-
34
-
35
-
36
-
37
-
38
-
39
-
40
-
41
-
42
-
43
-
44
-
45
-
46
-
47
-
48
-
49
-
50
-
51
-
52
-
53
-
54
-
55
-
56
-
57
-
58
-
59
-
60
-
61
-
62
-
63
-
64
-
65
-
66
-
67
-
68
-
69
-
70
-
71
-
72
-
73
-
74
-
75
-
76
-
77
-
78
-
79
-
80
-
81
-
82
-
83
-
84
-
85
-
86
-
87
-
88
-
89
-
90
-
91
-
92
-
93
-
94
-
95
-
96
-
97
-
98
-
99
-
100
-
101
-
102
-
103
-
104
-
105
-
106
-
107
-
108
-
109
-
110
-
111
-
112
-
113
-
114
-
115
-
116
-
117
-
118
-
119
-
120
-
121
-
122
-
123
-
124
-
125
-
126
-
127
-
128
-
129
-
130
-
131
-
132
-
133
-
134
-
135
-
136
-
137
-
138
-
139
-
140
-
141
-
142
-
143
-
144
-
145
-
146
-
147
-
148
-
149
-
150
-
151
-
152
 |
 |

18 Ford Motor Company | 2013 Annual Report
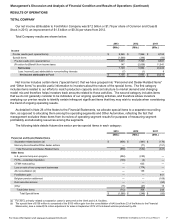
Management’s Discussion and Analysis of Financial Condition and Results of Operations (Continued)
Not shown in the table above are tax benefits of $2.2 billion, $315 million, and $14.2 billion for 2013, 2012, and 2011,
respectively, that we consider to be special items. For 2013, these included the impact of a favorable increase in deferred
tax assets related to investments in our European operations and the release of valuation allowances held against U.S.
state and local deferred tax assets. For 2011, these primarily consisted of the release of almost all of the valuation
allowance against our net deferred tax assets in the United States, Canada, and Spain.
Discussion of Automotive sector, Financial Services sector, and total Company results of operations below is on a pre-
tax basis and excludes special items unless otherwise specifically noted. References to records by Automotive segments
—North America, South America, Europe, and Asia Pacific Africa—are since at least 2000 when we began reporting
results for these segments.
The chart below shows 2013 pre-tax results by sector:
Total Company 2013 pre-tax profit of $8.6 billion was among the best in our history. Compared with 2012, total
Company pre-tax profit increased by $603 million, explained by higher Automotive sector results.