Ford 2013 Annual Report Download - page 114
Download and view the complete annual report
Please find page 114 of the 2013 Ford annual report below. You can navigate through the pages in the report by either clicking on the pages listed below, or by using the keyword search tool below to find specific information within the annual report.-
 1
1 -
2
-
3
-
4
-
5
-
6
-
7
-
8
-
9
-
10
-
11
-
12
-
13
-
14
-
15
-
16
-
17
-
18
-
19
-
20
-
21
-
22
-
23
-
24
-
25
-
26
-
27
-
28
-
29
-
30
-
31
-
32
-
33
-
34
-
35
-
36
-
37
-
38
-
39
-
40
-
41
-
42
-
43
-
44
-
45
-
46
-
47
-
48
-
49
-
50
-
51
-
52
-
53
-
54
-
55
-
56
-
57
-
58
-
59
-
60
-
61
-
62
-
63
-
64
-
65
-
66
-
67
-
68
-
69
-
70
-
71
-
72
-
73
-
74
-
75
-
76
-
77
-
78
-
79
-
80
-
81
-
82
-
83
-
84
-
85
-
86
-
87
-
88
-
89
-
90
-
91
-
92
-
93
-
94
-
95
-
96
-
97
-
98
-
99
-
100
-
101
-
102
-
103
-
 104
104 -
 105
105 -
 106
106 -
 107
107 -
 108
108 -
 109
109 -
 110
110 -
 111
111 -
 112
112 -
 113
113 -
 114
114 -
 115
115 -
 116
116 -
 117
117 -
 118
118 -
 119
119 -
 120
120 -
 121
121 -
 122
122 -
 123
123 -
 124
124 -
125
-
126
-
127
-
128
-
129
-
130
-
131
-
132
-
133
-
134
-
135
-
136
-
137
-
138
-
139
-
140
-
141
-
142
-
143
-
144
-
145
-
146
-
147
-
148
-
149
-
150
-
151
-
152
 |
 |

112 Ford Motor Company | 2013 Annual Report
FORD MOTOR COMPANY AND SUBSIDIARIES
NOTES TO THE FINANCIAL STATEMENTS
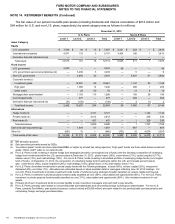
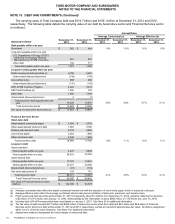
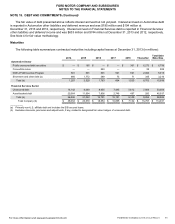
NOTE 14. RETIREMENT BENEFITS (Continued)
The following table summarizes the changes in Level 3 pension benefits plan assets measured at fair value on a
recurring basis for the year ended December 31, 2012 (in millions):
2012
Return on plan assets
U.S. Plans
Fair
Value
at
January 1,
2012
Attributable
to Assets
Held
at
December 31,
2012
Attributable
to
Assets
Sold
Net
Purchases/
(Settlements)
Transfers
Into/ (Out of)
Level 3
Fair
Value
at
December 31,
2012
Asset Category
Equity
U.S. companies $ 15 $ — $ — $ — $ — $ 15
International companies 3 — 3 (3) — 3
Total equity 18 — 3 (3) — 18
Fixed Income
U.S. government — — — — — —
U.S. government-sponsored enterprises 8 — — (5) — 3
Non-U.S. government 169 2 5 (137) (7) 32
Corporate bonds
Investment grade 33 5 (4) 14 32 80
High yield 11 1 1 4 (3) 14
Other credit 17 5 — 28 — 50
Mortgage/other asset-backed 54 1 3 43 14 115
Derivative financial instruments 6 (3) (9) 10 (4) —
Total fixed income 298 11 (4) (43) 32 294
Alternatives
Hedge funds 2,968 189 (6) (30) — 3,121
Private equity 2,085 201 —126 — 2,412
Real estate 362 31 1 63 — 457
Total alternatives 5,415 421 (5) 159 — 5,990
Other (2) 2 — 67 (10) 57
Total Level 3 fair value $ 5,729 $434 $ (6) $ 180 $ 22 $ 6,359
Non-U.S. Plan
Asset Category
Equity
U.S. companies $ — $ — $ — $ — $ — $ —
International companies 1 — — — — 1
Total equity 1 — — — — 1
Fixed Income
U.S. government — — — — — —
U.S. government-sponsored enterprises — — — — — —
Non-U.S. government 122 1 9 (31)(60) 41
Corporate bonds
Investment grade 11 114522
High yield — — — 1 — 1
Other credit — — — 6 — 6
Mortgage/other asset-backed 6 — — 14 828
Derivative financial instruments (6) — (3) — 8(1)
Total fixed income 133 2 7 (6) (39) 97
Alternatives
Hedge funds 1,053 79 10 — — 1,142
Private equity 123 14 — 99 — 236
Real estate 160 4 (1) 166 —329
Total alternatives 1,336 97 9 265 — 1,707
Other (a) 4,358 312 — — — 4,670
Total Level 3 fair value $ 5,828 $411 $ 16 $ 259 $(39) $ 6,475
_______
(a) Primarily Ford-Werke plan assets (insurance contract valued at $3,609 million).