Ford 2013 Annual Report Download - page 24
Download and view the complete annual report
Please find page 24 of the 2013 Ford annual report below. You can navigate through the pages in the report by either clicking on the pages listed below, or by using the keyword search tool below to find specific information within the annual report.-
 1
1 -
2
-
3
-
4
-
5
-
6
-
7
-
8
-
9
-
10
-
11
-
12
-
13
-
 14
14 -
 15
15 -
 16
16 -
 17
17 -
 18
18 -
 19
19 -
 20
20 -
 21
21 -
 22
22 -
 23
23 -
 24
24 -
 25
25 -
 26
26 -
 27
27 -
 28
28 -
 29
29 -
 30
30 -
 31
31 -
 32
32 -
 33
33 -
 34
34 -
35
-
36
-
37
-
38
-
39
-
40
-
41
-
42
-
43
-
44
-
45
-
46
-
47
-
48
-
49
-
50
-
51
-
52
-
53
-
54
-
55
-
56
-
57
-
58
-
59
-
60
-
61
-
62
-
63
-
64
-
65
-
66
-
67
-
68
-
69
-
70
-
71
-
72
-
73
-
74
-
75
-
76
-
77
-
78
-
79
-
80
-
81
-
82
-
83
-
84
-
85
-
86
-
87
-
88
-
89
-
90
-
91
-
92
-
93
-
94
-
95
-
96
-
97
-
98
-
99
-
100
-
101
-
102
-
103
-
104
-
105
-
106
-
107
-
108
-
109
-
110
-
111
-
112
-
113
-
114
-
115
-
116
-
117
-
118
-
119
-
120
-
121
-
122
-
123
-
124
-
125
-
126
-
127
-
128
-
129
-
130
-
131
-
132
-
133
-
134
-
135
-
136
-
137
-
138
-
139
-
140
-
141
-
142
-
143
-
144
-
145
-
146
-
147
-
148
-
149
-
150
-
151
-
152
 |
 |

22 Ford Motor Company | 2013 Annual Report
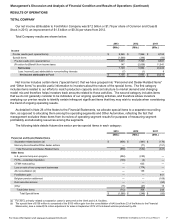
Management’s Discussion and Analysis of Financial Condition and Results of Operations (Continued)
North America Segment. The charts below detail key metrics and the change in 2013 pre-tax results compared with
2012 by causal factor.
North America continued to perform well, driven by a strong industry, our strong product line-up, growth in U.S. market
share, continued discipline in matching production to real demand, and a lean cost structure—even as we invested more
in product and capacity for future growth.
As shown above, North America’s full-year wholesale volume and revenue both improved 11% compared with 2012.
Operating margin was 9.9%, 0.5 percentage points lower than a year ago, while pre-tax profit was $8.8 billion, up about
$400 million. The increase in pre-tax profit for 2013 compared with 2012 is more than explained by favorable market
factors, offset partially by higher costs, mainly structural and warranty costs.
For the full year, total U.S. market share was up 0.5 percentage points, more than explained by F-Series and Fusion,
and U.S. retail share of retail industry was up 0.4 percentage points, more than explained by F-Series, Escape, and
Fusion.