Ford 2013 Annual Report Download - page 124
Download and view the complete annual report
Please find page 124 of the 2013 Ford annual report below. You can navigate through the pages in the report by either clicking on the pages listed below, or by using the keyword search tool below to find specific information within the annual report.-
 1
1 -
2
-
3
-
4
-
5
-
6
-
7
-
8
-
9
-
10
-
11
-
12
-
13
-
14
-
15
-
16
-
17
-
18
-
19
-
20
-
21
-
22
-
23
-
24
-
25
-
26
-
27
-
28
-
29
-
30
-
31
-
32
-
33
-
34
-
35
-
36
-
37
-
38
-
39
-
40
-
41
-
42
-
43
-
44
-
45
-
46
-
47
-
48
-
49
-
50
-
51
-
52
-
53
-
54
-
55
-
56
-
57
-
58
-
59
-
60
-
61
-
62
-
63
-
64
-
65
-
66
-
67
-
68
-
69
-
70
-
71
-
72
-
73
-
74
-
75
-
76
-
77
-
78
-
79
-
80
-
81
-
82
-
83
-
84
-
85
-
86
-
87
-
88
-
89
-
90
-
91
-
92
-
93
-
94
-
95
-
96
-
97
-
98
-
99
-
100
-
101
-
102
-
103
-
104
-
105
-
106
-
107
-
108
-
109
-
110
-
111
-
112
-
113
-
 114
114 -
 115
115 -
 116
116 -
 117
117 -
 118
118 -
 119
119 -
 120
120 -
 121
121 -
 122
122 -
 123
123 -
 124
124 -
 125
125 -
 126
126 -
 127
127 -
 128
128 -
 129
129 -
 130
130 -
 131
131 -
 132
132 -
 133
133 -
 134
134 -
135
-
136
-
137
-
138
-
139
-
140
-
141
-
142
-
143
-
144
-
145
-
146
-
147
-
148
-
149
-
150
-
151
-
152
 |
 |

122 Ford Motor Company | 2013 Annual Report
FORD MOTOR COMPANY AND SUBSIDIARIES
NOTES TO THE FINANCIAL STATEMENTS
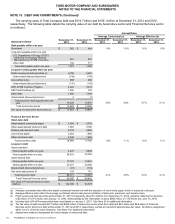
NOTE 16. DERIVATIVE FINANCIAL INSTRUMENTS AND HEDGING ACTIVITIES (Continued)
Income Effect of Derivative Financial Instruments
The following table summarizes by hedge designation the pre-tax gains/(losses) recorded in Other comprehensive
income/(loss) (“OCI”), reclassified from Accumulated other comprehensive income/(loss) (“AOCI”) to income and/or
recognized directly in income for the years ended December 31 (in millions):
2013 2012 2011
Gains/
(Losses)
Recorded
in OCI
Gains/
(Losses)
Reclassified
from AOCI
to Income
Gains/
(Losses)
Recognized
in Income
Gains/
(Losses)
Recorded
in OCI
Gains/
(Losses)
Reclassified
from AOCI
to Income
Gains/
(Losses)
Recognized
in Income
Gains/
(Losses)
Recorded
in OCI
Gains/
(Losses)
Reclassified
from AOCI
to Income
Gains/
(Losses)
Recognized
in Income
Automotive Sector
Cash flow hedges
Foreign currency exchange
contracts $ 317 $ (80) $ (3) $ (371) $ (377) $ 1 $ (100) $ 119 $ (3)
Derivatives not designated as
hedging instruments
Foreign currency exchange
contracts $ (26) $ (138) $ 20
Commodity contracts (84) (65) (423)
Other – warrants — (4) (1)
Total $(110) $ (207) $ (404)
Financial Services Sector
Fair value hedges
Interest rate contracts
Net interest settlements
and accruals excluded
from the assessment of
hedge effectiveness $ 254 $ 177 $217
Ineffectiveness (a) (44) 16 (30)
Total $ 210 $ 193 $187
Derivatives not designated as
hedging instruments
Interest rate contracts $ (33) $ (14) $ (5)
Foreign currency exchange
contracts 21 (70)(48)
Cross-currency interest rate
swap contracts (88) (150) (3)
Other (b) — (81) 65
Total $(100) $ (315) $ 9
__________
(a) For 2013, 2012, and 2011, hedge ineffectiveness reflects change in fair value on derivatives of $658 million loss, $228 million gain, and $433 million
gain, respectively, and change in value on hedged debt attributable to the change in benchmark interest rate of $614 million gain, $212 million loss,
and $463 million loss, respectively.
(b) Reflects gains/(losses) for derivative features included in the FUEL Notes (see Note 4).