Ford 2013 Annual Report Download - page 77
Download and view the complete annual report
Please find page 77 of the 2013 Ford annual report below. You can navigate through the pages in the report by either clicking on the pages listed below, or by using the keyword search tool below to find specific information within the annual report.-
 1
1 -
2
-
3
-
4
-
5
-
6
-
7
-
8
-
9
-
10
-
11
-
12
-
13
-
14
-
15
-
16
-
17
-
18
-
19
-
20
-
21
-
22
-
23
-
24
-
25
-
26
-
27
-
28
-
29
-
30
-
31
-
32
-
33
-
34
-
35
-
36
-
37
-
38
-
39
-
40
-
41
-
42
-
43
-
44
-
45
-
46
-
47
-
48
-
49
-
50
-
51
-
52
-
53
-
54
-
55
-
56
-
57
-
58
-
59
-
60
-
61
-
62
-
63
-
64
-
65
-
66
-
 67
67 -
 68
68 -
 69
69 -
 70
70 -
 71
71 -
 72
72 -
 73
73 -
 74
74 -
 75
75 -
 76
76 -
 77
77 -
 78
78 -
 79
79 -
 80
80 -
 81
81 -
 82
82 -
 83
83 -
 84
84 -
 85
85 -
 86
86 -
 87
87 -
88
-
89
-
90
-
91
-
92
-
93
-
94
-
95
-
96
-
97
-
98
-
99
-
100
-
101
-
102
-
103
-
104
-
105
-
106
-
107
-
108
-
109
-
110
-
111
-
112
-
113
-
114
-
115
-
116
-
117
-
118
-
119
-
120
-
121
-
122
-
123
-
124
-
125
-
126
-
127
-
128
-
129
-
130
-
131
-
132
-
133
-
134
-
135
-
136
-
137
-
138
-
139
-
140
-
141
-
142
-
143
-
144
-
145
-
146
-
147
-
148
-
149
-
150
-
151
-
152
 |
 |

Ford Motor Company | 2013 Annual Report 75
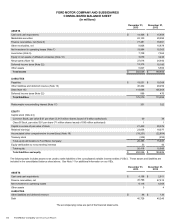
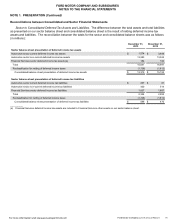
FORD MOTOR COMPANY AND SUBSIDIARIES
NOTES TO THE FINANCIAL STATEMENTS
NOTE 1. PRESENTATION (Continued)
Reconciliations between Consolidated and Sector Financial Statements
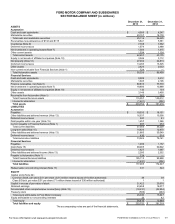
Sector to Consolidated Deferred Tax Assets and Liabilities. The difference between the total assets and total liabilities
as presented on our sector balance sheet and consolidated balance sheet is the result of netting deferred income tax
assets and liabilities. The reconciliation between the totals for the sector and consolidated balance sheets was as follows
(in millions):
December 31,
2013
December 31,
2012
Sector balance sheet presentation of deferred income tax assets
Automotive sector current deferred income tax assets $ 1,574 $ 3,488
Automotive sector non-current deferred income tax assets 13,283 13,325
Financial Services sector deferred income tax assets (a) 184 184
Total 15,041 16,997
Reclassification for netting of deferred income taxes (1,726)(1,812)
Consolidated balance sheet presentation of deferred income tax assets $ 13,315 $ 15,185
Sector balance sheet presentation of deferred income tax liabilities
Automotive sector current deferred income tax liabilities $ 267 $ 81
Automotive sector non-current deferred income tax liabilities 430 514
Financial Services sector deferred income tax liabilities 1,627 1,687
Total 2,324 2,282
Reclassification for netting of deferred income taxes (1,726)(1,812)
Consolidated balance sheet presentation of deferred income tax liabilities $ 598 $470
__________
(a) Financial Services deferred income tax assets are included in Financial Services other assets on our sector balance sheet.
For more information visit www.annualreport.ford.com