Ford 2013 Annual Report Download - page 57
Download and view the complete annual report
Please find page 57 of the 2013 Ford annual report below. You can navigate through the pages in the report by either clicking on the pages listed below, or by using the keyword search tool below to find specific information within the annual report.-
 1
1 -
2
-
3
-
4
-
5
-
6
-
7
-
8
-
9
-
10
-
11
-
12
-
13
-
14
-
15
-
16
-
17
-
18
-
19
-
20
-
21
-
22
-
23
-
24
-
25
-
26
-
27
-
28
-
29
-
30
-
31
-
32
-
33
-
34
-
35
-
36
-
37
-
38
-
39
-
40
-
41
-
42
-
43
-
44
-
45
-
46
-
 47
47 -
 48
48 -
 49
49 -
 50
50 -
 51
51 -
 52
52 -
 53
53 -
 54
54 -
 55
55 -
 56
56 -
 57
57 -
 58
58 -
 59
59 -
 60
60 -
 61
61 -
 62
62 -
 63
63 -
 64
64 -
 65
65 -
 66
66 -
 67
67 -
68
-
69
-
70
-
71
-
72
-
73
-
74
-
75
-
76
-
77
-
78
-
79
-
80
-
81
-
82
-
83
-
84
-
85
-
86
-
87
-
88
-
89
-
90
-
91
-
92
-
93
-
94
-
95
-
96
-
97
-
98
-
99
-
100
-
101
-
102
-
103
-
104
-
105
-
106
-
107
-
108
-
109
-
110
-
111
-
112
-
113
-
114
-
115
-
116
-
117
-
118
-
119
-
120
-
121
-
122
-
123
-
124
-
125
-
126
-
127
-
128
-
129
-
130
-
131
-
132
-
133
-
134
-
135
-
136
-
137
-
138
-
139
-
140
-
141
-
142
-
143
-
144
-
145
-
146
-
147
-
148
-
149
-
150
-
151
-
152
 |
 |

Ford Motor Company | 2013 Annual Report 55
Management’s Discussion and Analysis of Financial Condition and Results of Operations (Continued)
Assumptions are set at each year end and are generally not changed unless there is a major plan event such as a
significant curtailment or settlement that would trigger a plan remeasurement
The effects of actual results differing from our assumptions and the effects of changing assumptions are recorded as
unamortized net gains or losses in Accumulated other comprehensive income/(loss) on our balance sheet. Unamortized
gains and losses are amortized over future periods and, therefore, generally affect our recognized expense in future
periods.
See Note 14 of the Notes to the Financial Statements for more information regarding pension and OPEB costs and
assumptions.
Pension Plans
Effect of Actual Results. The year-end 2013 weighted average discount rate was 4.74% for U.S. plans and 4.07% for
non-U.S. plans, reflecting increases of 90 and 15 basis points, respectively, compared with year-end 2012. In 2013, the
U.S. actual return on assets was 3.7%, which was lower than the expected long-term rate of return of 7.4%. These
differences resulted in a net reduction in unamortized losses of about $4 billion which are expected to be recognized as a
component of net expense over the expected future years of service (approximately 11 years for the major U.S. plans).
For 2014, the expected long-term rate of return on assets for U.S. plans is 6.89%, down about 50 basis points
compared with a year ago, reflecting higher fixed income allocation.
Worldwide pension expense excluding special items was $1.6 billion in 2013. Based on year-end assumptions, we
expect 2014 pension expense to be lower compared with 2013.
De-risking Strategy. As previously disclosed, we adopted a broad global de-risking strategy which increases the
matching characteristics of our assets relative to our obligation as funded status improves. Changes in interest rates
(which directly influence changes in discount rates), in addition to other factors, have a significant impact on the value of
our pension obligation and fixed income asset portfolio. As we de-risk our plans and increase their allocation to fixed
income investments over time, we expect that the funded status sensitivity to changes in interest rates will be significantly
reduced, as any change should result in offsetting effects in the value of our pension obligation and the value of the fixed
income asset portfolio.
Sensitivity Analysis. The December 31, 2013 pension funded status and 2014 expense are affected by year-end
2013 assumptions. Sensitivities to these assumptions may be asymmetric and are specific to the time periods noted.
The effects of changes in the factors which generally have the largest impact on year-end funded status and pension
expense are discussed below.
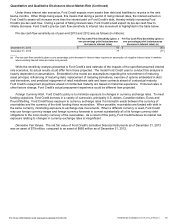
Discount rates and interest rates have the largest impact on our net funded status. The table below estimates the
impact as of December 31, 2013 on our funded status of an increase/decrease in discount rates and interest rates (in
millions):
Basis Increase/(Decrease) in
Point December 31, 2013 Funded Status
Factor Change U.S. Plans Non-U.S. Plans
Discount rate - obligation +/- 100 bps. $4,300/(5,300) $4,200/(4,800)
Interest rate - fixed income assets +/- 100 (3,500)/4,300 (1,200)/1,500
Net impact on funded status $800/(1,000) $3,000/(3,300)
The fixed income asset sensitivity shown excludes other fixed income return components (e.g., bond coupon and
active management excess returns), growth asset returns and changes in value of related insurance contracts. Other
factors that impact net funded status (e.g., contributions) are not reflected.
For more information visit www.annualreport.ford.com