Ford 2013 Annual Report Download - page 97
Download and view the complete annual report
Please find page 97 of the 2013 Ford annual report below. You can navigate through the pages in the report by either clicking on the pages listed below, or by using the keyword search tool below to find specific information within the annual report.-
 1
1 -
2
-
3
-
4
-
5
-
6
-
7
-
8
-
9
-
10
-
11
-
12
-
13
-
14
-
15
-
16
-
17
-
18
-
19
-
20
-
21
-
22
-
23
-
24
-
25
-
26
-
27
-
28
-
29
-
30
-
31
-
32
-
33
-
34
-
35
-
36
-
37
-
38
-
39
-
40
-
41
-
42
-
43
-
44
-
45
-
46
-
47
-
48
-
49
-
50
-
51
-
52
-
53
-
54
-
55
-
56
-
57
-
58
-
59
-
60
-
61
-
62
-
63
-
64
-
65
-
66
-
67
-
68
-
69
-
70
-
71
-
72
-
73
-
74
-
75
-
76
-
77
-
78
-
79
-
80
-
81
-
82
-
83
-
84
-
85
-
86
-
 87
87 -
 88
88 -
 89
89 -
 90
90 -
 91
91 -
 92
92 -
 93
93 -
 94
94 -
 95
95 -
 96
96 -
 97
97 -
 98
98 -
 99
99 -
 100
100 -
 101
101 -
 102
102 -
 103
103 -
 104
104 -
 105
105 -
 106
106 -
 107
107 -
108
-
109
-
110
-
111
-
112
-
113
-
114
-
115
-
116
-
117
-
118
-
119
-
120
-
121
-
122
-
123
-
124
-
125
-
126
-
127
-
128
-
129
-
130
-
131
-
132
-
133
-
134
-
135
-
136
-
137
-
138
-
139
-
140
-
141
-
142
-
143
-
144
-
145
-
146
-
147
-
148
-
149
-
150
-
151
-
152
 |
 |

Ford Motor Company | 2013 Annual Report 95
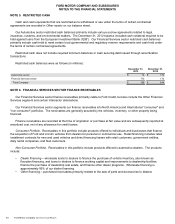
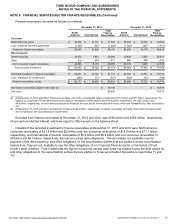
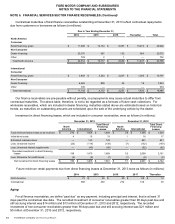
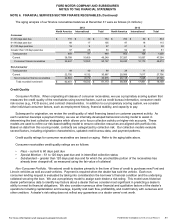
FORD MOTOR COMPANY AND SUBSIDIARIES
NOTES TO THE FINANCIAL STATEMENTS
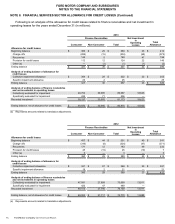
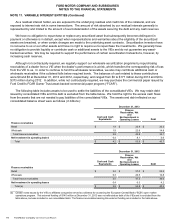
NOTE 9. INVENTORIES
All inventories are stated at the lower of cost or market. Cost for a substantial portion of U.S. inventories is
determined on a last-in, first-out (“LIFO”) basis. LIFO was used for 20% and 18% of total inventories at December 31,
2013 and 2012, respectively. Cost of other inventories is determined by costing methods that approximate a first-in, first-
out (“FIFO”) basis.
Inventories were as follows (in millions):
December 31,
2013
December 31,
2012
Raw materials, work-in-process, and supplies $ 3,613 $ 3,697
Finished products 5,058 4,614
Total inventories under FIFO 8,671 8,311
Less: LIFO adjustment (963) (949)
Total inventories $ 7,708 $ 7,362
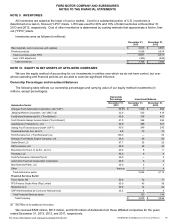
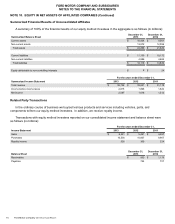
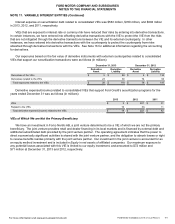
NOTE 10. EQUITY IN NET ASSETS OF AFFILIATED COMPANIES
We use the equity method of accounting for our investments in entities over which we do not have control, but over
whose operating and financial policies we are able to exercise significant influence.
Ownership Percentages and Investment Balances
The following table reflects our ownership percentages and carrying value of our equity method investments (in
millions, except percentages):
Ownership
Percentage Investment Balance
Automotive Sector
December 31,
2013
December 31,
2013
December 31,
2012
Changan Ford Automobile Corporation, Ltd (“CAF”) 50.0% $ 1,429 $990
Jiangling Motors Corporation, Ltd (“JMC”) (a) 32.0 535 419
FordSollers Netherlands B.V. (“FordSollers”) 50.0 376 407
Ford Otomotiv Sanayi Anonim Sirketi (“Ford Otosan”) 41.0 336 394
AutoAlliance (Thailand) Co., Ltd. 50.0 395 391
Getrag Ford Transmissions GmbH (“GFT”) 50.0 249 242
Tenedora Nemak, S.A. de C.V. 6.8 79 73
Ford Romania S.A. (“Ford Romania”) (a) 100.0 — 63
Changan Ford Mazda Engine Company, Ltd. 25.0 59 50
DealerDirect LLC 97.7 25 25
OEConnection LLC 50.0 28 20
Blue Diamond Truck, S. de R.L. de C.V. 25.0 8 11
Percepta, LLC 45.0 9 9
Ford Performance Vehicles Pty Ltd. 49.0 —5
Automotive Fuel Cell Cooperation Corporation 49.9 8 5
Blue Diamond Parts, LLC 25.0 3 4
Other Various 7 4
Total Automotive sector 3,546 3,112
Financial Services Sector
Forso Nordic AB 50.0 72 71
FFS Finance South Africa (Pty) Limited 50.0 43 39
RouteOne LLC 30.0 14 20
CNF-Administradora de Consorcio Nacional Ltda. 33.3 4 4
Total Financial Services sector 133 134
Total Company $ 3,679 $ 3,246
__________
(a) See Note 23 for additional information.
We received $529 million, $610 million, and $316 million of dividends from these affiliated companies for the years
ended December 31, 2013, 2012, and 2011, respectively.
For more information visit www.annualreport.ford.com