GE 2006 Annual Report Download - page 102
Download and view the complete annual report
Please find page 102 of the 2006 GE annual report below. You can navigate through the pages in the report by either clicking on the pages listed below, or by using the keyword search tool below to find specific information within the annual report.-
 1
1 -
2
-
3
-
4
-
5
-
6
-
7
-
8
-
9
-
10
-
11
-
12
-
13
-
14
-
15
-
16
-
17
-
18
-
19
-
20
-
21
-
22
-
23
-
24
-
25
-
26
-
27
-
28
-
29
-
30
-
31
-
32
-
33
-
34
-
35
-
36
-
37
-
38
-
39
-
40
-
41
-
42
-
43
-
44
-
45
-
46
-
47
-
48
-
49
-
50
-
51
-
52
-
53
-
54
-
55
-
56
-
57
-
58
-
59
-
60
-
61
-
62
-
63
-
64
-
65
-
66
-
67
-
68
-
69
-
70
-
71
-
72
-
73
-
74
-
75
-
76
-
77
-
78
-
79
-
80
-
81
-
82
-
83
-
84
-
85
-
86
-
87
-
88
-
89
-
90
-
91
-
 92
92 -
 93
93 -
 94
94 -
 95
95 -
 96
96 -
 97
97 -
 98
98 -
 99
99 -
 100
100 -
 101
101 -
 102
102 -
 103
103 -
 104
104 -
 105
105 -
 106
106 -
 107
107 -
 108
108 -
 109
109 -
 110
110 -
 111
111 -
 112
112 -
113
-
114
-
115
-
116
-
117
-
118
-
119
-
120
 |
 |

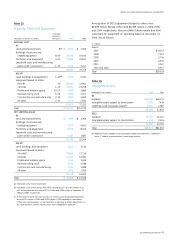
Note 26
Operating Segments
REVENUES
(a)
Total revenues (b)
Intersegment revenues External revenues
(In millions) 2006 2005 2004 2006 2005 2004 2006 2005 2004
Infrastructure
$ 47,429 $ 41,803 $ 37,373 $ 246 $ 448 $ 535 $ 47,183 $ 41,355 $ 36,838
Commercial Finance 23,792 20,646 19,524 871 761 718 22,921 19,885 18,806
GE Money 21,759 19,416 15,734 51 63 41 21,708 19,353 15,693
Healthcare
16,562 15,153 13,456 4 9 — 16,558 15,144 13,456
NBC Universal 16,188 14,689 12,886 52 — — 16,136 14,689 12,886
Industrial 33,494 32,631 30,722 593 714 524 32,901 31,917 30,198
Corporate items and eliminations 4,167 3,618 4,596 (1,817) (1,995) (1,818) 5,984 5,613 6,414
Total $163,391 $147,956 $134,291 $ — $ — $ — $163,391 $147,956 $134,291
(a) Revenues of GE businesses include income from sales of goods and services to customers and other income.
(b) Sales from one component to another generally are priced at equivalent commercial selling prices.
Revenues originating from operations based in the United States based outside the United States were $74,268 million, $64,133
were $89,123 million, $83,823 million and $76,874 million in 2006, million and $57,417 million in 2006, 2005 and 2004, respectively.
2005 and 2004, respectively. Revenues originating from operations
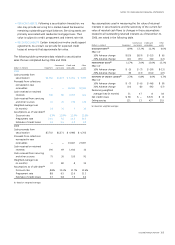
Assets(a) Property, plant and equipment additions
(b) Depreciation and amortization
At December 31 For the years ended December 31 For the years ended December 31
(In millions) 2006 2005 2004 2006 2005 2004 2006 2005 2004
Infrastructure
$100,237 $ 89,555 $ 82,798 $ 4,873 $ 4,188 $ 3,938 $ 2,497 $2,436 $2,162
Commercial Finance 233,536 190,546 184,388 7,056 5,426 4,573 3,188 2,648 2,772
GE Money 190,403 158,829 151,255 238 189 217 438 393 334
Healthcare
26,949 24,661 24,871 655 460 1,590 786 617 565
NBC Universal 31,425 31,196 34,206 245 275 1,189 361 339 273
Industrial 81,178 41,556 42,040 4,887 4,367 4,111 3,298 3,292 3,292
Corporate items and eliminations 33,511 136,978 231,059 192 199 194 258 208 245
Total $697,239 $673,321 $750,617 $18,146 $15,104 $15,812 $10,826 $9,933 $9,643
(a) Assets of discontinued operations are included in Corporate items and eliminations for all periods presented.
(b) Additions to property, plant and equipment include amounts relating to principal businesses purchased.
Interest and other financial charges Provision for income taxes
(In millions) 2006 2005 2004 2006 2005 2004
Infrastructure
(a) $ 2,067 $ 1,706 $ 1,436 $ 199 $ (202) $ 62
Commercial Finance 7,878 5,893 4,720 893 971 1,144
GE Money 6,766 5,443 3,564 389 529 449
Industrial(a) 609 536 526 61 64 (124)
Corporate items and eliminations(b) 1,966 1,524 1,370 2,412 2,673 2,165
Total $19,286 $15,102 $11,616 $3,954 $4,035 $3,696
(a) Included only portions of the segment that are financial services businesses.
(b) Included amounts for Healthcare, NBC Universal and the industrial businesses of Infrastructure and Industrial, for which our measure of segment profit excludes interest and
other financial charges and income taxes.
Property, plant and equipment associated with operations based
in the United States were $27,413 million, $26,195 million and
$25,296 million at year-end 2006, 2005 and 2004, respectively.
Property, plant and equipment associated with operations based
outside the United States were $47,553 million, $41,333 million
and $37,807 million at year-end 2006, 2005 and 2004, respectively.
Basis for presentation
Our operating businesses are organized based on the nature
of markets and customers. Segment accounting policies are the
same as described in note 1.
A description of our operating segments can be found on
page 108 and details of segment profit by operating segment
can be found in the Summary of Operating Segments table on
page 53 of this report.
100 ge 2006 annual report