GE 2006 Annual Report Download - page 96
Download and view the complete annual report
Please find page 96 of the 2006 GE annual report below. You can navigate through the pages in the report by either clicking on the pages listed below, or by using the keyword search tool below to find specific information within the annual report.-
 1
1 -
2
-
3
-
4
-
5
-
6
-
7
-
8
-
9
-
10
-
11
-
12
-
13
-
14
-
15
-
16
-
17
-
18
-
19
-
20
-
21
-
22
-
23
-
24
-
25
-
26
-
27
-
28
-
29
-
30
-
31
-
32
-
33
-
34
-
35
-
36
-
37
-
38
-
39
-
40
-
41
-
42
-
43
-
44
-
45
-
46
-
47
-
48
-
49
-
50
-
51
-
52
-
53
-
54
-
55
-
56
-
57
-
58
-
59
-
60
-
61
-
62
-
63
-
64
-
65
-
66
-
67
-
68
-
69
-
70
-
71
-
72
-
73
-
74
-
75
-
76
-
77
-
78
-
79
-
80
-
81
-
82
-
83
-
84
-
85
-
 86
86 -
 87
87 -
 88
88 -
 89
89 -
 90
90 -
 91
91 -
 92
92 -
 93
93 -
 94
94 -
 95
95 -
 96
96 -
 97
97 -
 98
98 -
 99
99 -
 100
100 -
 101
101 -
 102
102 -
 103
103 -
 104
104 -
 105
105 -
 106
106 -
107
-
108
-
109
-
110
-
111
-
112
-
113
-
114
-
115
-
116
-
117
-
118
-
119
-
120
 |
 |

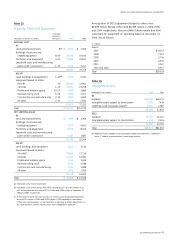
LONG-TERM BORROWINGS
2006
December 31 (Dollars in millions)
Average
rate(a) Maturities 2006 2005
GE
Senior notes 5.06% 2008–2013 $ 6,488 $ 6,486
Industrial development/
pollution control bonds 4.11 2011–2027 307 299
Payable to banks,
principally U.S. 5.68 2008–2015 1,836 1,912
Other(b) 454 384
9,085 9,081
GECS
Senior notes
Unsecured 4.95 2008–2055 235,952 180,546
Asset-backed
(c) 5.83 2008–2035
5,810 6,845
Extendible notes 5.32 2009–2011 6,000 14,022
Subordinated notes
(d) 5.92 2009–2066
5,201 2,984
252,963 204,397
ELIMINATIONS (1,244) (1,197)
Total $260,804 $212,281
(a) Based on year-end balances and year-end local currency interest rates, including
the effects of related interest rate and currency swaps, if any, directly associated
with the original debt issuance.
(b) A variety of obligations having various interest rates and maturities, including
certain borrowings by parent operating components and affi liates.
(c) Included $4,684 million and $6,845 million of asset-backed senior notes, issued by
consolidated, liquidating securitization entities at December 31, 2006 and 2005,
respectively. See note 28.
(d) Included $750 million of subordinated notes guaranteed by GE at December 31,
2006 and 2005.
Our borrowings are addressed below from the perspectives of
liquidity, interest rate and currency risk management. Additional
information about borrowings and associated swaps can be
found in note 27.
LIQUIDITY is affected by debt maturities and our ability to repay
or refinance such debt. Long-term debt maturities over the next
fi ve years follow.
(In millions) 2007 2008 2009 2010 2011
GE $ 32 $ 1,572 $ 1,716 $ 42 $ 39
GECS 44,522 (a) 53,282(b) 44,069 34,175 20,889
(a) Floating rate extendible notes of $256 million are due in 2007, but are extendible
at the option of the investors to a final maturity in 2008. Fixed and fl oating rate
notes of $975 million contain put options with exercise dates in 2007, and which
have final maturity dates in 2008 ($350 million), 2009 ($100 million) and beyond
2012 ($525 million).
(b) Floating rate extendible notes of $6,000 million are due in 2008, of which $2,000
million are extendible at the option of the investors to a final maturity in 2009, and
$4,000 million are extendible to a final maturity in 2011.
Committed credit lines totaling $59.9 billion had been extended
to us by 75 banks at year-end 2006. Included in this amount was
$50.4 billion provided directly to GECS and $9.5 billion provided
by 16 banks to GE, to which GECS also has access. The GECS
lines include $28.6 billion of revolving credit agreements under
which we can borrow funds for periods exceeding one year. The
remaining $31.3 billion are 364-day lines of which $31.2 billion
contain a term-out feature that allows GE or GECS to extend the
borrowings for one year from the date of expiration of the lending
agreement. We pay banks for credit facilities, but compensation
amounts were insignificant in each of the past three years.
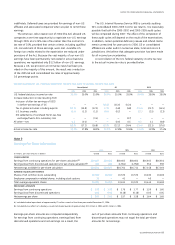
INTEREST RATE AND CURRENCY RISK is managed through the direct
issuance of debt or use of derivatives. We take positions in view
of anticipated behavior of assets, including prepayment behavior.
We use a variety of instruments, including interest rate and cur-
rency swaps and currency forwards, to achieve our interest rate
objectives.
The following table provides additional information about
derivatives designated as hedges of borrowings in accordance
with SFAS 133, Accounting for Derivative Instruments and
Hedging Activities, as amended.
DERIVATIVE FAIR VALUES BY ACTIVITY/INSTRUMENT
December 31 (In millions) 2006 2005
Cash fl ow hedges $ 763 $ 726
Fair value hedges (147) (39)
Total $ 616 $ 687
Interest rate swaps $ (860) $ (423)
Currency swaps 1,476 1,110
Total $ 616 $ 687
We regularly assess the effectiveness of all other hedge positions
using a variety of techniques, including cumulative dollar offset
and regression analysis, depending on which method was
selected at inception of the respective hedge. Adjustments
related to fair value hedges decreased the carrying amount of
debt outstanding at December 31, 2006, by $111 million. At
December 31, 2006, the maximum term of derivative instru-
ments that hedge forecasted transactions was 29 years and
related to hedges of long-term, non-U.S. dollar denominated
fixed rate debt. See note 27.
94 ge 2006 annual report