GE 2006 Annual Report Download - page 2
Download and view the complete annual report
Please find page 2 of the 2006 GE annual report below. You can navigate through the pages in the report by either clicking on the pages listed below, or by using the keyword search tool below to find specific information within the annual report.-
 1
1 -
 2
2 -
 3
3 -
 4
4 -
 5
5 -
 6
6 -
 7
7 -
 8
8 -
 9
9 -
 10
10 -
 11
11 -
 12
12 -
 13
13 -
14
-
15
-
16
-
17
-
18
-
19
-
20
-
21
-
22
-
23
-
24
-
25
-
26
-
27
-
28
-
29
-
30
-
31
-
32
-
33
-
34
-
35
-
36
-
37
-
38
-
39
-
40
-
41
-
42
-
43
-
44
-
45
-
46
-
47
-
48
-
49
-
50
-
51
-
52
-
53
-
54
-
55
-
56
-
57
-
58
-
59
-
60
-
61
-
62
-
63
-
64
-
65
-
66
-
67
-
68
-
69
-
70
-
71
-
72
-
73
-
74
-
75
-
76
-
77
-
78
-
79
-
80
-
81
-
82
-
83
-
84
-
85
-
86
-
87
-
88
-
89
-
90
-
91
-
92
-
93
-
94
-
95
-
96
-
97
-
98
-
99
-
100
-
101
-
102
-
103
-
104
-
105
-
106
-
107
-
108
-
109
-
110
-
111
-
112
-
113
-
114
-
115
-
116
-
117
-
118
-
119
-
120
 |
 |

Thanks to the customers, partners and GE employees
who appear in this annual report for contributing
their time and support.
This document was printed on paper that contains
from 10% to 100% post-consumer material.
The majority of the power utilized was renewable
energy, produced with GE’s wind and biogas
technologies, and powered by GE steam engines
and turbine engines. The paper was supplied by
participants of the Sustainable Initiative Programs.
GE employed a printer that produces all of its
own electricity and is a verifi ed totally enclosed
facility that produces virtually no volatile organic
compound emissions.
Visit our interactive online annual report
at www.ge.com/annual06
Design: VSA Partners, Inc. Principal Photography: Douglas Menuez, John Midgley, Jason Schmidt Printing: Cenveo Anderson Lithograph
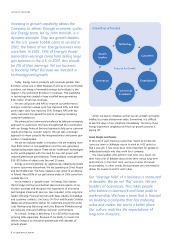
3 Letter to Investors
12 Winning in the Future
20 Leadership Businesses
24 Execution & Financial Discipline
26 Growth as a Process
34 Our People
40 Governance
44 Citizenship
45 Financial Section
114 Corporate Management
116 Corporate Information
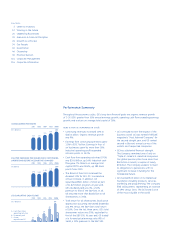
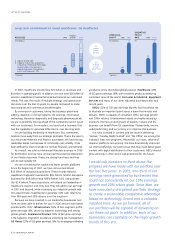
CONSOLIDATED REVENUES
2002 2003 2004 2005 2006
(In $ billions) 163
148
134
112 113
DILUTED EARNINGS PER SHARE FROM CONTINUING
OPERATIONS BEFORE ACCOUNTING CHANGES
2002 2003 2004 2005 2006
(In dollars) 1.99
1.76
1.59
1.46 1.40
GE CUMULATIVE CASH FLOWS
2002 2003 2004 2005 2006
(In $ billions) 84
60
A. Cash flows from 38
operating activities
B. Dividends paid 23
C. Shares 10
repurchased ($)
Performance Summary
A
B
C
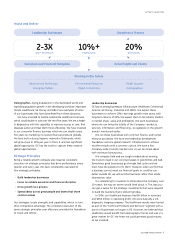
Throughout the economic cycles, GE’s long-term financial goals are: organic revenue growth
of 2–3X GDP; greater than 10% annual earnings growth; operating cash flow exceeding earnings
growth; and a return on average total capital of 20%.
here is how ge performed in 2006:
• Continuing revenues increased 10% to
$163.4 billion. Organic revenue growth
was 9%.
• Earnings from continuing operations grew
11% to $20.7 billion. Earnings in four of
six businesses grew by more than 10%.
Industrial operating profi t expanded
40 basis points to 15.2%.
• Cash flow from operating activities (CFOA)
was $24.6 billion, up 14%. Industrial cash
flow grew 7%. Return on average total
capital (ROTC) was 18.4%, up 180 basis
points from 2005.
• The Board of Directors increased the
dividend 12% for GE’s 31st consecutive
annual increase. In addition, GE
repurchased $8.1 billion of stock as part
of its $25 billion program. At year end,
GE’s dividend yield was 3%, a 50%
premium to that of the S&P 500. In all,
GE returned more than $18 billion to GE
shareowners in 2006.
• Total return for GE shareowners (stock price
appreciation assuming reinvested dividends)
was 9% versus the S&P 500’s total return
of 16%. Over the last three years, GE’s total
shareowner return was 30%, equivalent to
that of the S&P 500. At year end, GE traded
at a forward price/earnings ratio (PE) of
16.8X, a 10% premium to the S&P 500.
• GE continued to earn the respect of the
business world. GE was named FORTUNE
magazine’s “Most Admired Company” for
the second straight year, and GE ranked
second in Barron’s annual survey of the
world’s most respected companies.
• GE has substantial fi nancial strength.
The Company remained one of only six
“Triple-A”-rated U.S. industrial companies.
Our global pension plans have more than
$60 billion in assets, a surplus of nearly
$9 billion. The Company expects to meet
its obligations to pensioners with no
significant increase in funding for the
foreseeable future.
• GE invested $15 billion in its intellectual
foundation including products, services,
marketing and programming. The Company
filed 2,650 patents, representing an increase
of 19% versus 2001. The GE brand is one
of the most valuable in the world.