GE 2006 Annual Report Download - page 82
Download and view the complete annual report
Please find page 82 of the 2006 GE annual report below. You can navigate through the pages in the report by either clicking on the pages listed below, or by using the keyword search tool below to find specific information within the annual report.-
 1
1 -
2
-
3
-
4
-
5
-
6
-
7
-
8
-
9
-
10
-
11
-
12
-
13
-
14
-
15
-
16
-
17
-
18
-
19
-
20
-
21
-
22
-
23
-
24
-
25
-
26
-
27
-
28
-
29
-
30
-
31
-
32
-
33
-
34
-
35
-
36
-
37
-
38
-
39
-
40
-
41
-
42
-
43
-
44
-
45
-
46
-
47
-
48
-
49
-
50
-
51
-
52
-
53
-
54
-
55
-
56
-
57
-
58
-
59
-
60
-
61
-
62
-
63
-
64
-
65
-
66
-
67
-
68
-
69
-
70
-
71
-
 72
72 -
 73
73 -
 74
74 -
 75
75 -
 76
76 -
 77
77 -
 78
78 -
 79
79 -
 80
80 -
 81
81 -
 82
82 -
 83
83 -
 84
84 -
 85
85 -
 86
86 -
 87
87 -
 88
88 -
 89
89 -
 90
90 -
 91
91 -
 92
92 -
93
-
94
-
95
-
96
-
97
-
98
-
99
-
100
-
101
-
102
-
103
-
104
-
105
-
106
-
107
-
108
-
109
-
110
-
111
-
112
-
113
-
114
-
115
-
116
-
117
-
118
-
119
-
120
 |
 |

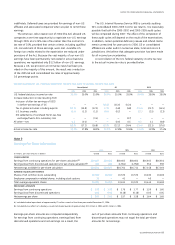
The effect on operations of principal retiree benefit plans follows.
COST OF PRINCIPAL RETIREE BENEFIT PLANS
(In millions) 2006 2005 2004
Expected return on plan assets $(127) $ (138) $(149)
Service cost for benefi ts earned 229 243 210
Interest cost on benefi t obligation 455 507 518
Prior service cost 363 326 298
Net actuarial loss recognized 64 70 60
Retiree benefit plans cost $ 984 $1,008 $ 937
ACTUARIAL ASSUMPTIONS. The discount rates at December 31
were used to measure the year-end benefit obligations and the
earnings effects for the subsequent year. Actuarial assumptions
used to determine benefit obligations and earnings effects for
principal retiree benefit plans follow.
ACTUARIAL ASSUMPTIONS
December 31 2006 2005 2004 2003
Discount rate(a) 5.75% 5.25% 5.75% 6.00%
Compensation increases 5.00 5.00 5.00 5.00
Expected return on assets 8.50 8.50 8.50 8.50
Initial healthcare trend rate
(b) 9.20 10.00 10.30 10.50
(a) Weighted average discount rates of 5.90% and 6.40% were used for determination
of costs in 2004 and 2003, respectively.
(b) For 2006, gradually declining to 5% for 2013 and thereafter.
To determine the expected long-term rate of return on retiree
life plan assets, we consider the current and expected asset
allocations, as well as historical and expected returns on various
categories of plan assets. We apply our expected rate of return
to a market-related value of assets, which stabilizes variability in
assets to which we apply that expected return.
We amortize experience gains and losses, as well as the
effects of changes in actuarial assumptions and plan provisions,
over a period no longer than the average future service of
employees.
FUNDING POLICY. We fund retiree health benefits on a pay-as-
you-go basis. We expect to contribute approximately $700 million
in 2007 to fund such benefits. We fund retiree life insurance
benefits at our discretion.
Changes in the accumulated postretirement benefi t obligation
for retiree benefit plans follow.
ACCUMULATED POSTRETIREMENT BENEFIT OBLIGATION (APBO)
(In millions) 2006 2005
Balance at January 1 $9,084 $9,250
Service cost for benefi ts earned 229 243
Interest cost on benefi t obligation 455 507
Participant contributions 43 41
Actuarial gain (707) (55)
Benefi ts paid(a) (810) (856)
Other (32) (46)
Balance at December 31(b) $8,262 $9,084
(a) Net of Medicare Part D subsidy of $75 million in 2006.
(b) The APBO for the retiree health plans was $6,001 million and $6,713 million at
year-end 2006 and 2005, respectively.
Increasing or decreasing the healthcare cost trend rates by one
percentage point would have had an insignificant effect on the
December 31, 2006, accumulated postretirement benefi t obliga-
tion and the annual cost of retiree health plans. Our principal
retiree benefit plans are collectively bargained and have provisions
that limit our per capita costs.
Changes in the fair value of assets for retiree benefi t plans
follow.
FAIR VALUE OF PLAN ASSETS
(In millions) 2006 2005
Balance at January 1 $1,619 $1,652
Actual gain on plan assets 222 107
Employer contributions 636 675
Participant contributions 43 41
Benefi ts paid(a) (810) (856)
Balance at December 31 $1,710 $1,619
(a) Net of Medicare Part D subsidy of $75 million in 2006.
Plan assets are held in trust, as follows:
PLAN ASSET ALLOCATION
2006 2005
Target Actual Actual
December 31 allocation allocation allocation
U.S. equity securities 35–55% 44% 51%
Non-U.S. equity securities 15–25 22 19
Debt securities 15–30 18 20
Real estate 1–10 4 2
Private equities 1–11 3 1
Other 1–13 9 7
Total 100% 100%
Plan fiduciaries set investment policies and strategies for the trust.
Long-term strategic investment objectives include preserving
the funded status of the plan and balancing risk and return.
The plan fiduciaries oversee the investment allocation process,
which includes selecting investment managers, setting long-term
strategic targets and monitoring asset allocations. Target alloca-
tion ranges are guidelines, not limitations, and occasionally plan
fiduciaries will approve allocations above or below a target range.
80 ge 2006 annual report