GE 2006 Annual Report Download - page 80
Download and view the complete annual report
Please find page 80 of the 2006 GE annual report below. You can navigate through the pages in the report by either clicking on the pages listed below, or by using the keyword search tool below to find specific information within the annual report.-
 1
1 -
2
-
3
-
4
-
5
-
6
-
7
-
8
-
9
-
10
-
11
-
12
-
13
-
14
-
15
-
16
-
17
-
18
-
19
-
20
-
21
-
22
-
23
-
24
-
25
-
26
-
27
-
28
-
29
-
30
-
31
-
32
-
33
-
34
-
35
-
36
-
37
-
38
-
39
-
40
-
41
-
42
-
43
-
44
-
45
-
46
-
47
-
48
-
49
-
50
-
51
-
52
-
53
-
54
-
55
-
56
-
57
-
58
-
59
-
60
-
61
-
62
-
63
-
64
-
65
-
66
-
67
-
68
-
69
-
 70
70 -
 71
71 -
 72
72 -
 73
73 -
 74
74 -
 75
75 -
 76
76 -
 77
77 -
 78
78 -
 79
79 -
 80
80 -
 81
81 -
 82
82 -
 83
83 -
 84
84 -
 85
85 -
 86
86 -
 87
87 -
 88
88 -
 89
89 -
 90
90 -
91
-
92
-
93
-
94
-
95
-
96
-
97
-
98
-
99
-
100
-
101
-
102
-
103
-
104
-
105
-
106
-
107
-
108
-
109
-
110
-
111
-
112
-
113
-
114
-
115
-
116
-
117
-
118
-
119
-
120
 |
 |

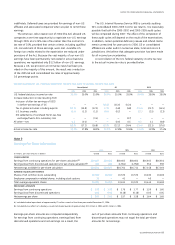
The following table summarizes the incremental effects of the
initial adoption of SFAS 158 on our Statement of Financial
Position at December 31, 2006.
(In millions)
Before
Application
of SFAS 158
SFAS 158
Adjustments
After
Application
of SFAS 158
All other assets $ 99,809 $(2,697) $ 97,112
Total assets 699,936 (2,697) 697,239
All other liabilities 43,047 3,837 46,884
Deferred income taxes 16,886 (2,715) 14,171
Total liabilities 576,225 1,122 577,347
Accumulated gains (losses) — net
Benefit plans (587) (3,819) (4,406)
Total shareowners’ equity 116,133 (3,819) 112,314
Total liabilities and equity 699,936 (2,697) 697,239
See notes 6 and 7 for further details on our retiree health and
life benefit plans and pension plans, respectively.
Note 2
Discontinued Operations
We classified GE Life, Genworth Financial, Inc. (Genworth) and
most of GE Insurance Solutions as discontinued operations.
Associated results of operations, financial position and cash
flows are separately reported for all periods presented.
Sale of GE Life
In December 2006, we completed the sale of GE Life, our U.K.-
based life insurance operation, to Swiss Reinsurance Company
(Swiss Re) for $910 million. As a result, we recognized an after-tax
loss of $267 million during 2006. GE Life revenues from discon-
tinued operations were $2,096 million, $2,286 million and $708
million in 2006, 2005 and 2004, respectively. In total, GE Life loss
from discontinued operations, net of taxes, was $178 million and
$28 million in 2006 and 2005, respectively, compared with earn-
ings from discontinued operations of $25 million in 2004.
Sale of GE Insurance Solutions
In June 2006, we completed the sale of the property and casualty
insurance and reinsurance businesses and the European life
and health operations of GE Insurance Solutions to Swiss Re for
$9,297 million, including the assumption of $1,700 million of
debt. We received $5,359 million in cash and $2,238 million of
newly issued Swiss Re common stock, representing a 9% interest
in Swiss Re. As a result, we recognized after-tax losses of
$134 million and $934 million in 2006 and 2005, respectively.
GE Insurance Solutions revenues from discontinued operations
were $2,815 million, $7,451 million and $8,625 million in 2006,
2005 and 2004, respectively. In total, GE Insurance Solutions
earnings from discontinued operations, net of taxes, were
$148 million and $90 million in 2006 and 2004, respectively,
compared with a loss of $2,850 million in 2005.
Sale of Genworth
In March 2006, we completed the sale of our remaining 18%
investment in Genworth through a secondary public offering of
71 million shares of Class A Common Stock and direct sale to
Genworth of 15 million shares of Genworth Class B Common
Stock. As a result of initial and secondary public offerings, we
recognized after-tax gains of $220 million and $552 million in
2006 and 2005, respectively, compared with an after-tax loss of
$336 million in 2004. Genworth revenues from discontinued
operations were $5 million, $7,908 million and $10,148 million in
2006, 2005 and 2004, respectively. In total, Genworth earnings
from discontinued operations, net of taxes, were $193 million,
$928 million and $444 million in 2006, 2005 and 2004, respectively.
Summarized financial information for discontinued operations
is shown below.
(In millions) 2006 2005 2004
OPERATIONS
Revenues from services $4,916 $17,645 $19,481
Earnings (loss) from discontinued
operations before minority interest
and income taxes $ 382 $ (1,726) $ 1,517
Minority interest — 394 200
Earnings (loss) from discontinued
operations before income taxes 382 (2,120) 1,317
Income tax benefi t (expense) (38) 552 (422)
Earnings (loss) from discontinued
operations before disposal,
net of taxes $ 344 $ (1,568) $ 895
DISPOSAL
Gain (loss) on disposal before
income taxes $ (75) $ 629 $ (570)
Income tax benefi t (expense) (106) (1,011) 234
Loss on disposal, net of taxes $ (181) $ (382) $ (336)
EARNINGS (LOSS) FROM DISCONTINUED
OPERATIONS, NET OF TAXES $ 163 $ (1,950) $ 559
December 31 (In millions) 2005
ASSETS
Cash and equivalents $ 2,976
Investment securities 37,633
Other GECS receivables 13,915
Other 6,542
Assets of discontinued operations 61,066
ELIMINATIONS —
Total $61,066
LIABILITIES AND EQUITY
Investment contracts, insurance liabilities
and insurance annuity benefi ts $43,378
Other 6,385
Liabilities of discontinued operations 49,763
ELIMINATIONS (236)
Total $49,527
Total accumulated nonowner changes
other than earnings $ 652
Accrued liabilities of $475 million as of December 31, 2006, will
be settled beginning in 2007.
78 ge 2006 annual report