GE 2006 Annual Report Download - page 107
Download and view the complete annual report
Please find page 107 of the 2006 GE annual report below. You can navigate through the pages in the report by either clicking on the pages listed below, or by using the keyword search tool below to find specific information within the annual report.-
 1
1 -
2
-
3
-
4
-
5
-
6
-
7
-
8
-
9
-
10
-
11
-
12
-
13
-
14
-
15
-
16
-
17
-
18
-
19
-
20
-
21
-
22
-
23
-
24
-
25
-
26
-
27
-
28
-
29
-
30
-
31
-
32
-
33
-
34
-
35
-
36
-
37
-
38
-
39
-
40
-
41
-
42
-
43
-
44
-
45
-
46
-
47
-
48
-
49
-
50
-
51
-
52
-
53
-
54
-
55
-
56
-
57
-
58
-
59
-
60
-
61
-
62
-
63
-
64
-
65
-
66
-
67
-
68
-
69
-
70
-
71
-
72
-
73
-
74
-
75
-
76
-
77
-
78
-
79
-
80
-
81
-
82
-
83
-
84
-
85
-
86
-
87
-
88
-
89
-
90
-
91
-
92
-
93
-
94
-
95
-
96
-
 97
97 -
 98
98 -
 99
99 -
 100
100 -
 101
101 -
 102
102 -
 103
103 -
 104
104 -
 105
105 -
 106
106 -
 107
107 -
 108
108 -
 109
109 -
 110
110 -
 111
111 -
 112
112 -
 113
113 -
 114
114 -
 115
115 -
 116
116 -
 117
117 -
118
-
119
-
120
 |
 |

(Dollars in millions) Equipment
Commercial
real estate
Credit card
receivables
Other
assets
2006
Cash proceeds from
securitization
Proceeds from collections
reinvested in new
receivables
Cash received on retained
interests
Cash received from servicing
and other sources
Weighted average lives
(in months)
Assumptions as of sale date(a)
Discount rate
Prepayment rate
Estimate of credit losses
$2,784
—
236
45
23
8.3%
10.4
1.4
$4,427
—
80
26
75
12.8%
7.6
0.5
$ 5,251
16,360
2,307
219
7
12.0%
12.5
6.8
$ 7,782
30,584
341
126
39
12.6%
20.2
0.8
2005
Cash proceeds from
securitization
Proceeds from collections
reinvested in new
receivables
Cash received on retained
interests
Cash received from servicing
and other sources
Weighted average lives
(in months)
Assumptions as of sale date(a)
Discount rate
Prepayment rate
Estimate of credit losses
$3,702
—
190
75
37
8.8%
8.8
2.3
$5,571
—
69
36
80
13.4%
6.5
0.8
$ 6,985
10,067
1,644
155
8
11.7%
12.6
7.5
$ 4,705
27,697
10
91
35
12.6%
21.2
0.6
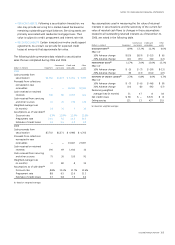
• SERVICING ASSETS. Following a securitization transaction, we
also may provide servicing for a market-based fee based on
remaining outstanding principal balances. Servicing assets are
primarily associated with residential mortgage loans. Their
value is subject to credit, prepayment and interest rate risk.
• RECOURSE LIABILITY. Certain transactions involve credit support
agreements. As a result, we provide for expected credit
losses at amounts that approximate fair value.
The following table summarizes data related to securitization
sales that we completed during 2006 and 2005.
(a) Based on weighted averages.
Key assumptions used in measuring the fair value of retained
interests in securitizations and the sensitivity of the current fair
value of residual cash flows to changes in those assumptions
related to all outstanding retained interests as of December 31,
2006, are noted in the following table.
Commercial
real estate
Credit card
receivables
Other
assets (Dollars in millions) Equipment
DISCOUNT RATE(a) 8.9% 13.2% 11.2% 6.6%
Effect of
10% Adverse change $ (10) $(19) $ (15) $ (6)
20% Adverse change (21) (35) (30) (13)
PREPAYMENT RATE(a) 11.7% 3.0% 12.0% 13.2%
Effect of
10% Adverse change $ (5) $ (7) $ (59) $ (13)
20% Adverse change (9) (13) (110) (22)
ESTIMATE OF CREDIT LOSSES(a) 2.3% 0.8% 6.6% 0.3%
Effect of
10% Adverse change $ (7) $ (6) $ (48) $ (9)
20% Adverse change (14) (8) (95) (17)
Remaining weighted
average lives (in months) 31 47 8 18
Net credit losses $ 58 $ — $ 576 $ 8
Delinquencies 121 13 437 315
(a) Based on weighted averages.
ge 2006 annual report 105