GE 2006 Annual Report Download - page 87
Download and view the complete annual report
Please find page 87 of the 2006 GE annual report below. You can navigate through the pages in the report by either clicking on the pages listed below, or by using the keyword search tool below to find specific information within the annual report.-
 1
1 -
2
-
3
-
4
-
5
-
6
-
7
-
8
-
9
-
10
-
11
-
12
-
13
-
14
-
15
-
16
-
17
-
18
-
19
-
20
-
21
-
22
-
23
-
24
-
25
-
26
-
27
-
28
-
29
-
30
-
31
-
32
-
33
-
34
-
35
-
36
-
37
-
38
-
39
-
40
-
41
-
42
-
43
-
44
-
45
-
46
-
47
-
48
-
49
-
50
-
51
-
52
-
53
-
54
-
55
-
56
-
57
-
58
-
59
-
60
-
61
-
62
-
63
-
64
-
65
-
66
-
67
-
68
-
69
-
70
-
71
-
72
-
73
-
74
-
75
-
76
-
 77
77 -
 78
78 -
 79
79 -
 80
80 -
 81
81 -
 82
82 -
 83
83 -
 84
84 -
 85
85 -
 86
86 -
 87
87 -
 88
88 -
 89
89 -
 90
90 -
 91
91 -
 92
92 -
 93
93 -
 94
94 -
 95
95 -
 96
96 -
 97
97 -
98
-
99
-
100
-
101
-
102
-
103
-
104
-
105
-
106
-
107
-
108
-
109
-
110
-
111
-
112
-
113
-
114
-
115
-
116
-
117
-
118
-
119
-
120
 |
 |

indefinitely. Deferred taxes are provided for earnings of non-U.S.
affiliates and associated companies when we plan to remit those
earnings.
The American Jobs Creation Act of 2004 (the Act) allowed U.S.
companies a one-time opportunity to repatriate non-U.S. earnings
through 2005 at a 5.25% rate of tax rather than the normal U.S.
tax rate of 35%, provided that certain criteria, including qualifi ed
U.S. reinvestment of those earnings, were met. Available U.S.
foreign tax credits related to the repatriation are reduced under
provisions of the Act. Because the vast majority of our non-U.S.
earnings have been permanently reinvested in active business
operations, we repatriated only $1.2 billion of non-U.S. earnings.
Because a U.S. tax provision at normal tax rates had been pro-
vided on the majority of this amount, the result was a reduction
of the 2005 GE and consolidated tax rates of approximately
0.5 percentage points.
The U.S. Internal Revenue Service (IRS) is currently auditing
GE’s consolidated 2000–2005 income tax returns. It is reasonably
possible that both the 2000–2002 and 2003–2005 audit cycles
will be completed during 2007. The effect of the completion of
these audit cycles will depend on the result of the examinations.
In addition, certain potential deficiency issues and refund claims
remain unresolved for years prior to 2000. GE or consolidated
affiliates are under audit in numerous state, local and non-U.S.
jurisdictions. We believe that adequate provision has been made
for all income tax uncertainties.
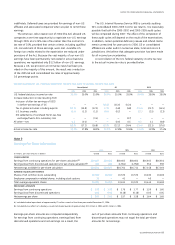
A reconciliation of the U.S. federal statutory income tax rate
to the actual income tax rate is provided below.
RECONCILIATION OF U.S. FEDERAL STATUTORY INCOME TAX RATE TO ACTUAL INCOME TAX RATE
Consolidated GE GECS
2006 2005 2004 2006 2005 2004 2006 2005 2004
U.S. federal statutory income tax rate 35.0% 35.0% 35.0% 35.0% 35.0% 35.0% 35.0% 35.0% 35.0%
Increase (reduction) in rate resulting from
Inclusion of after-tax earnings of GECS
in before-tax earnings of GE — — — (15.8) (15.6) (15.4) — — —
Tax on global activities including exports (17.7) (15.8) (12.3) (7.7) (5.8) (5.8)
(21.6) (21.7) (14.5)
U.S. business credits (1.4) (1.3) (1.1) (0.4) (0.2) — (2.1) (2.5) (2.3)
IRS settlements of Lockheed Martin tax-free
exchange/Puerto Rico subsidiary loss — — (3.4) — — (3.7) — — —
All other — net 0.2 (0.1) — — (0.6) 0.5 0.3 1.1 (0.8)
(18.9) (17.2)
Actual income tax rate 16.1% 17.8%
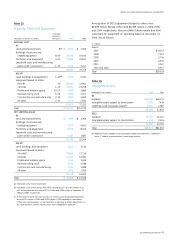
Note 9
Earnings Per Share Information
2006 2005 2004
(In millions; per-share amounts in dollars) Diluted Basic Diluted Basic Diluted Basic
CONSOLIDATED
Earnings from continuing operations for per-share calculation
(a)
Earnings (loss) from discontinued operations for per-share calculation
(b)
$20,667
163
$20,666
163
$18,662
(1,961)
$18,661
(1,950)
$16,602
556
$16,601
559
Net earnings available for per-share calculation $20,830 $20,829 $16,701 $16,711 $17,158 $17,160
AVERAGE EQUIVALENT SHARES
Shares of GE common stock outstanding
Employee compensation-related shares, including stock options
10,359
35
10,359
—
10,570
41
10,570
—
10,400
45
10,400
—
Total average equivalent shares 10,394 10,359 10,611 10,570 10,445 10,400
PER-SHARE AMOUNTS
Earnings from continuing operations
Earnings (loss) from discontinued operations
$ 1.99
0.02
$ 1.99
0.02
$ 1.76
(0.18)
$ 1.77
(0.18)
$ 1.59
0.05
$ 1.60
0.05
Net earnings per share $ 2.00 $ 2.01 $ 1.57 $ 1.58 $ 1.64 $ 1.65
(16.8)
18.2%
(23.9)
11.1%
(22.2) (24.4) (23.4) (23.1)
12.8% 10.6% 11.6% 11.9%
(17.6)
17.4%
(a) Included dividend equivalents of approximately $1 million in each of the three years ended December 31, 2006.
(b) Included dilutive effects of subsidiary-issued stock-based awards of approximately $11 million in 2005 and $2 million in 2004.
Earnings-per-share amounts are computed independently sum of per-share amounts from continuing operations and
for earnings from continuing operations, earnings (loss) from discontinued operations may not equal the total per-share
discontinued operations and net earnings. As a result, the amounts for net earnings.
ge 2006 annual report 85