GE 2006 Annual Report Download - page 86
Download and view the complete annual report
Please find page 86 of the 2006 GE annual report below. You can navigate through the pages in the report by either clicking on the pages listed below, or by using the keyword search tool below to find specific information within the annual report.-
 1
1 -
2
-
3
-
4
-
5
-
6
-
7
-
8
-
9
-
10
-
11
-
12
-
13
-
14
-
15
-
16
-
17
-
18
-
19
-
20
-
21
-
22
-
23
-
24
-
25
-
26
-
27
-
28
-
29
-
30
-
31
-
32
-
33
-
34
-
35
-
36
-
37
-
38
-
39
-
40
-
41
-
42
-
43
-
44
-
45
-
46
-
47
-
48
-
49
-
50
-
51
-
52
-
53
-
54
-
55
-
56
-
57
-
58
-
59
-
60
-
61
-
62
-
63
-
64
-
65
-
66
-
67
-
68
-
69
-
70
-
71
-
72
-
73
-
74
-
75
-
 76
76 -
 77
77 -
 78
78 -
 79
79 -
 80
80 -
 81
81 -
 82
82 -
 83
83 -
 84
84 -
 85
85 -
 86
86 -
 87
87 -
 88
88 -
 89
89 -
 90
90 -
 91
91 -
 92
92 -
 93
93 -
 94
94 -
 95
95 -
 96
96 -
97
-
98
-
99
-
100
-
101
-
102
-
103
-
104
-
105
-
106
-
107
-
108
-
109
-
110
-
111
-
112
-
113
-
114
-
115
-
116
-
117
-
118
-
119
-
120
 |
 |

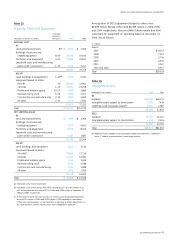
Our recorded assets and liabilities for pension plans are as follows:
PREPAID PENSION ASSET (LIABILITY)
Principal pension plans Other pension plans
December 31 (In millions) 2006 2005 2006 2005
Funded status(a) $11,465 $ 5,765 $(2,599) $(2,884)
Unrecognized prior
service cost (b) 1,004 (b) 37
Unrecognized net
actuarial loss (b) 8,445 (b) 2,046
Net amount recognized $11,465 $15,214 $(2,599) $ (801)
Pension asset (liability)
recorded in the Statement
of Financial Position
Prepaid pension asset $15,019 $17,853 $ 46 $ 114
Unfunded liabilities
Due within one year
(c) (106) (90) (49) (43)
Due after one year
(c) (3,448) (2,549) (2,596) (2,154)
Intangible assets — — (b) 54
Shareowners’ equity — — (b) 1,228
Net amount recognized $11,465 $15,214 $(2,599) $ (801)
Amounts recorded in
shareowners’ equity
Prior service cost $ 831 $ — $ 15 $ —
Net actuarial loss 2,162 — 1,704 —
Total $ 2,993 $ — $ 1,719 $ —
(a) Fair value of assets less PBO, as shown in the preceding tables.
(b) Amounts recognized in shareowners’ equity in 2006 upon adoption of SFAS 158.
See note 1.
(c) For principal pension plans, represents the GE Supplementary Pension Plan liability.
The estimated prior service cost and net actuarial loss for the
principal pension plans that will be amortized from shareowners’
equity into pension cost in 2007 are $200 million and $700 million,
respectively. For other pension plans, the estimated prior service
cost and net actuarial loss to be amortized over the next fi scal
year is $10 million and $160 million, respectively. Comparable
amortized amounts in 2006, respectively, were $253 million and
$729 million for principal pension plans and $5 million and
$164 million for other pension plans.
Estimated future benefit payments are as follows:
ESTIMATED FUTURE BENEFIT PAYMENTS
2012–
2016(In millions) 2007 2008 2009 2010 2011
Principal
pension
plans $2,500 $2,500 $2,550 $2,600 $2,600 $14,500
Other
pension
plans 325 300 300 325 350 1,875
Our labor agreements with various U.S. unions expire in June 2007,
and we will be engaged in negotiations to attain new agreements.
While results of the 2007 union negotiations cannot be predicted,
our recent past negotiations have resulted in agreements that
increased costs.
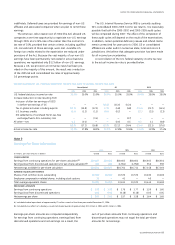
Note 8
Provision for Income Taxes
(In millions) 2006 2005 2004
GE
Current tax expense $1,738 $3,037 $2,148
Deferred tax expense (benefi t)
from temporary differences 842 (287) (175)
2,580 2,750 1,973
GECS
Current tax expense 266 1,938 1,497
Deferred tax expense (benefi t)
from temporary differences 1,108 (653) 226
1,374 1,285 1,723
CONSOLIDATED
Current tax expense 2,004 4,975 3,645
Deferred tax expense (benefi t)
from temporary differences 1,950 (940) 51
Total $3,954 $4,035 $3,696
GE and GECS file a consolidated U.S. federal income tax return.
The GECS provision for current tax expense includes its effect on
the consolidated return.
Consolidated current tax expense includes amounts appli-
cable to U.S. federal income taxes of $61 million, $2,543 million
and $629 million in 2006, 2005 and 2004, respectively, and
amounts applicable to non-U.S. jurisdictions of $1,738 million,
$2,224 million and $2,522 million in 2006, 2005 and 2004,
respectively. Consolidated deferred taxes related to U.S. federal
income taxes were an expense of $1,723 million in 2006 and
benefits of $137 million and $27 million in 2005 and 2004,
respectively.
Consolidated U.S. earnings from continuing operations before
income taxes were $9,245 million in 2006, $10,918 million in
2005 and $9,597 million in 2004. The corresponding amounts
for non-U.S.-based operations were $15,375 million in 2006,
$11,778 million in 2005 and $10,700 million in 2004.
Deferred income tax balances reflect the effects of temporary
differences between the carrying amounts of assets and liabilities
and their tax bases, as well as from net operating loss and tax
credit carryforwards, and are stated at enacted tax rates expected
to be in effect when taxes are actually paid or recovered. Deferred
income tax assets represent amounts available to reduce income
taxes payable on taxable income in future years. We evaluate
the recoverability of these future tax deductions by assessing
the adequacy of future expected taxable income from all sources,
including reversal of taxable temporary differences, forecasted
operating earnings and available tax planning strategies.
See note 21 for details.
We have not provided U.S. deferred taxes on cumulative
earnings of non-U.S. affiliates and associated companies that have
been reinvested indefinitely. These earnings relate to ongoing
operations and, at December 31, 2006, were approximately
$47 billion. Because of the availability of U.S. foreign tax credits,
it is not practicable to determine the U.S. federal income tax lia-
bility that would be payable if such earnings were not reinvested
84 ge 2006 annual report