GE 2006 Annual Report Download - page 111
Download and view the complete annual report
Please find page 111 of the 2006 GE annual report below. You can navigate through the pages in the report by either clicking on the pages listed below, or by using the keyword search tool below to find specific information within the annual report.-
 1
1 -
2
-
3
-
4
-
5
-
6
-
7
-
8
-
9
-
10
-
11
-
12
-
13
-
14
-
15
-
16
-
17
-
18
-
19
-
20
-
21
-
22
-
23
-
24
-
25
-
26
-
27
-
28
-
29
-
30
-
31
-
32
-
33
-
34
-
35
-
36
-
37
-
38
-
39
-
40
-
41
-
42
-
43
-
44
-
45
-
46
-
47
-
48
-
49
-
50
-
51
-
52
-
53
-
54
-
55
-
56
-
57
-
58
-
59
-
60
-
61
-
62
-
63
-
64
-
65
-
66
-
67
-
68
-
69
-
70
-
71
-
72
-
73
-
74
-
75
-
76
-
77
-
78
-
79
-
80
-
81
-
82
-
83
-
84
-
85
-
86
-
87
-
88
-
89
-
90
-
91
-
92
-
93
-
94
-
95
-
96
-
97
-
98
-
99
-
100
-
 101
101 -
 102
102 -
 103
103 -
 104
104 -
 105
105 -
 106
106 -
 107
107 -
 108
108 -
 109
109 -
 110
110 -
 111
111 -
 112
112 -
 113
113 -
 114
114 -
 115
115 -
 116
116 -
 117
117 -
 118
118 -
 119
119 -
 120
120
 |
 |

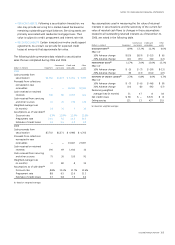
Financial Measures that Supplement Generally
Accepted Accounting Principles
We sometimes use information derived from consolidated fi nan-
cial information but not presented in our fi nancial statements
prepared in accordance with U.S. generally accepted accounting
principles (GAAP). Certain of these data are considered “non-
GAAP financial measures” under U.S. Securities and Exchange
Commission rules. Specifically, we have referred, in various
sections of this Annual Report, to:
• Organic revenue growth in 2006, 2005 and 2004 and the
average for the two and three years ended December 31, 2006
• Organic revenue growth for Energy in 2006
• GE operating profit excluding pension costs for 2006, 2005
and 2004
• Growth in Industrial cash from operating activities (CFOA)
in 2006
• Average total shareowners’ equity, excluding effects of
discontinued operations
• GE profit growth from 2001 to 2006, excluding the effect of
non-cash pension
• GE earnings from continuing operations before income taxes
excluding GECS earnings from continuing operations and the
corresponding effective tax rates, for the three years ended
December 31, 2006
• Delinquency rates on certain financing receivables of the
Commercial Finance and GE Money segments for 2006, 2005
and 2004
The reasons we use these non-GAAP financial measures and the
reconciliations to their most directly comparable GAAP fi nancial
measures follow.
Organic Revenue Growth
(In millions) 2006 2005 % change
GE consolidated revenues
as reported $163,391 $147,956
Less the effects of
Acquisitions, business dispositions
(other than dispositions of
businesses acquired for
investment) and currency
exchange rates 5,213 2,750
The 2006 Olympics broadcasts 684 —
GECS commercial paper interest
rate swap adjustment 197 540
GE consolidated revenues excluding
the effects of acquisitions, business
dispositions (other than dispositions of
businesses acquired for investment),
currency exchange rates, the 2006
Olympics broadcasts and the GECS
commercial paper interest rate swap
adjustment (organic revenues) $157,297 $144,666 9%
(In millions) 2005 2004 % change
GE consolidated revenues
as reported $147,956 $134,291
Less the effects of
Acquisitions, business dispositions
(other than dispositions of
businesses acquired for
investment) and currency
exchange rates 8,275 3,818
The 2004 Olympics broadcasts — 927
The May 2005 SFAS 133 correction — 503
GECS commercial paper interest
rate swap adjustment 540 518
GE consolidated revenues excluding
the effects of acquisitions, business
dispositions (other than dispositions
of businesses acquired for invest-
ment), currency exchange rates, the
2004 Olympics broadcasts, the
May 2005 SFAS 133 correction and
the GECS commercial paper
interest rate swap adjustment
(organic revenues) $139,141 $128,525 8%
Two-year average 8%
(In millions) 2004 2003 % change
GE consolidated revenues
as reported
Less the effects of
Acquisitions, business dispositions
(other than dispositions of
businesses acquired for
investment) and currency
exchange rates
Insurance
Energy
The May 2005 SFAS 133 correction
GECS commercial paper interest
rate swap adjustment
GE consolidated revenues excluding
the effects of acquisitions, business
dispositions (other than dispositions of
businesses acquired for investment),
currency exchange rates, Insurance,
Energy, the May 2005 SFAS 133
correction and the GECS commercial
paper interest rate swap adjustment
(organic revenues)
$134,291 $113,421
19,219 1,262
4,002 4,466
17,348 19,082
503 454
518 535
$ 92,701 $ 87,622 6%
Three-year average 8%
ge 2006 annual report 109