GE 2006 Annual Report Download - page 109
Download and view the complete annual report
Please find page 109 of the 2006 GE annual report below. You can navigate through the pages in the report by either clicking on the pages listed below, or by using the keyword search tool below to find specific information within the annual report.-
 1
1 -
2
-
3
-
4
-
5
-
6
-
7
-
8
-
9
-
10
-
11
-
12
-
13
-
14
-
15
-
16
-
17
-
18
-
19
-
20
-
21
-
22
-
23
-
24
-
25
-
26
-
27
-
28
-
29
-
30
-
31
-
32
-
33
-
34
-
35
-
36
-
37
-
38
-
39
-
40
-
41
-
42
-
43
-
44
-
45
-
46
-
47
-
48
-
49
-
50
-
51
-
52
-
53
-
54
-
55
-
56
-
57
-
58
-
59
-
60
-
61
-
62
-
63
-
64
-
65
-
66
-
67
-
68
-
69
-
70
-
71
-
72
-
73
-
74
-
75
-
76
-
77
-
78
-
79
-
80
-
81
-
82
-
83
-
84
-
85
-
86
-
87
-
88
-
89
-
90
-
91
-
92
-
93
-
94
-
95
-
96
-
97
-
98
-
 99
99 -
 100
100 -
 101
101 -
 102
102 -
 103
103 -
 104
104 -
 105
105 -
 106
106 -
 107
107 -
 108
108 -
 109
109 -
 110
110 -
 111
111 -
 112
112 -
 113
113 -
 114
114 -
 115
115 -
 116
116 -
 117
117 -
 118
118 -
 119
119 -
120
 |
 |

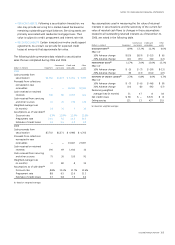
Note 30
Quarterly Information (Unaudited)
First quarter Second quarter Third quarter Fourth quarter
(In millions; per-share amounts in dollars) 2006 2005 2006 2005 2006 2005 2006 2005
CONSOLIDATED OPERATIONS
Earnings from continuing operations $ 4,177 $ 3,785 $ 4,948 $ 4,237 $ 4,962 $ 4,765 $ 6,579 $ 5,874
Earnings (loss) from discontinued operations 263 405 (2) 271 (95) 85 (3) (2,711)
Net earnings $ 4,440 $ 4,190 $ 4,946 $ 4,508 $ 4,867 $ 4,850 $ 6,576 $ 3,163
Per-share amounts — earnings from
continuing operations
Diluted earnings per share $ 0.40 $ 0.36 $ 0.48 $ 0.40 $ 0.48 $ 0.45 $ 0.64 $ 0.56
Basic earnings per share 0.40 0.36 0.48 0.40 0.48 0.45 0.64 0.56
Per-share amounts — earnings (loss) from
discontinued operations
Diluted earnings per share 0.03 0.04 — 0.03 (0.01) 0.01 — (0.26)
Basic earnings per share 0.03 0.04 — 0.03 (0.01) 0.01 — (0.26)
Per-share amounts — net earnings
Diluted earnings per share 0.42 0.39 0.48 0.42 0.47 0.46 0.64 0.30
Basic earnings per share 0.43 0.40 0.48 0.43 0.47 0.46 0.64 0.30
SELECTED DATA
GE
Sales of goods and services $23,086 $20,833 $24,448 $22,408 $24,478 $21,567 $27,096 $25,622
Gross profit from sales 5,781 5,824 6,701 6,358 6,283 5,978 7,644 7,455
GECS
Total revenues 14,889 13,963 15,455 13,722 16,112 15,137 17,146 14,729
Earnings from continuing operations 2,405 2,088 2,594 1,889 2,607 2,773 2,889 2,777
For GE, gross profit from sales is sales of goods and services less
costs of goods and services sold.
Earnings-per-share amounts are computed independently each
quarter for earnings from continuing operations, earnings (loss)
from discontinued operations and net earnings. As a result, the
sum of each quarter’s per-share amount may not equal the total
per-share amount for the respective year; and the sum of per-
share amounts from continuing operations and discontinued
operations may not equal the total per-share amounts for net
earnings for the respective quarters.
ge 2006 annual report 107