GE 2006 Annual Report Download - page 8
Download and view the complete annual report
Please find page 8 of the 2006 GE annual report below. You can navigate through the pages in the report by either clicking on the pages listed below, or by using the keyword search tool below to find specific information within the annual report.-
 1
1 -
 2
2 -
 3
3 -
 4
4 -
 5
5 -
 6
6 -
 7
7 -
 8
8 -
 9
9 -
 10
10 -
 11
11 -
 12
12 -
 13
13 -
 14
14 -
 15
15 -
 16
16 -
 17
17 -
 18
18 -
 19
19 -
20
-
21
-
22
-
23
-
24
-
25
-
26
-
27
-
28
-
29
-
30
-
31
-
32
-
33
-
34
-
35
-
36
-
37
-
38
-
39
-
40
-
41
-
42
-
43
-
44
-
45
-
46
-
47
-
48
-
49
-
50
-
51
-
52
-
53
-
54
-
55
-
56
-
57
-
58
-
59
-
60
-
61
-
62
-
63
-
64
-
65
-
66
-
67
-
68
-
69
-
70
-
71
-
72
-
73
-
74
-
75
-
76
-
77
-
78
-
79
-
80
-
81
-
82
-
83
-
84
-
85
-
86
-
87
-
88
-
89
-
90
-
91
-
92
-
93
-
94
-
95
-
96
-
97
-
98
-
99
-
100
-
101
-
102
-
103
-
104
-
105
-
106
-
107
-
108
-
109
-
110
-
111
-
112
-
113
-
114
-
115
-
116
-
117
-
118
-
119
-
120
 |
 |

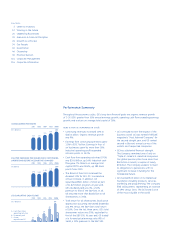
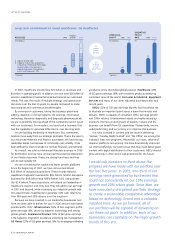
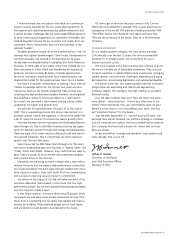
OPERATING
PROFIT
(In $ billions) (%)
REVENUES
(In $ billions)
0.6
1996 2007*
4.0
In 2007, Healthcare should have $20 billion in revenues and
$4 billion in operating profit. In addition, we now have $16 billion of
assets in Healthcare Financial Services built around our customers’
needs. This was the result of multiple strategic and operational
decisions over the last 10 years, by people motivated to make
technological and commercial breakthroughs.
Long-term commitment to Invest and Deliver: GE Healthcare
1996
Inorganic
growth
A. Organic Growth: $6.9
B. Inorganic Growth from acquisitions
in Healthcare Information Technology,
Clinical Systems, Life Sciences &
Medical Diagnostics, Interventional
and In Vitro Diagnostics: $9.1
9%
Organic
growth
per year
16%
Average
annual
growth rate
20.0
2007*
4.0
14
1996 2007*
OPERATING
PROFIT
RATE
20
BB
A
*Forecast *Forecast *Forecast
By serving our customers, taking the business global and
adding capability in clinical systems, life sciences, information
technology, laboratory diagnostics and diagnostic pharmaceuticals,
we are consistently moving ahead of the competition and in synch
with our customers. For investors, we have built a business that
has the capability to generate 20% returns over the long term.
We are building leadership in Healthcare. But, sometimes,
markets move away from our strategic principles. That is the case in
our Advanced Materials and Plastics businesses. We have strong
leadership teams, but because of commodity cost volatility, it has
been difficult for them to predict or hit their fi nancial commitments.
As a result, we sold our Advanced Materials business in 2006
for $3.8 billion. And we have announced the potential disposition
of our Plastics business. These are strong franchises and they
will do well outside GE.
We are reinvesting this capital into faster growth platforms.
Since the beginning of 2007, we have announced almost
$15 billion of industrial acquisitions. These include Abbott’s
Healthcare Diagnostic business (for $8.1 billion), Smiths’ Aerospace
business (for $4.8 billion) and ABB’s former Oil & Gas business
(for $1.9 billion). These acquisitions will extend our leadership in
Healthcare, Aviation and Oil & Gas. They will add to our earnings
in 2007 and beyond, while increasing our industrial growth rate.
We expect these investments to generate 15% cash returns by
their fifth year and 20% returns over the long term.
Because we have invested in our leadership businesses over
time, we were able to deliver for you in 2006 and are even better
positioned for 2007. Infrastructure (34% of GE’s segment profi t)
grew earnings 16%, driven by superior technology and strong
global growth. Commercial Finance (19% of GE) grew earnings
17%, fueled by origination excellence and strong risk management.
GE Money (13% of GE) grew earnings 15%, by leveraging marketing
excellence and a diversified global position. Healthcare (12%
of GE) grew earnings 18%, with excellent products satisfying
customers around the world. Consumer & Industrial, Equipment
Services and many of our other Industrial businesses also had
record years.
NBCU (11% of GE) saw earnings slip 6%. But this allows me
to illustrate an important point about a team that invests and
delivers. NBCU is capable of consistent 10%+ earnings growth
and 20%+ returns. Entertainment assets are highly valued by
investors. We have a strong team of leaders in place and the
business can benefit from GE capabilities. Momentarily, we are
underperforming, and our priority is to improve this business.
We have invested in content and the team is delivering.
“Heroes,” “Sunday Night Football” and “The Office” are among the
industry’s best new programs. Meanwhile, our news, cable and
Hispanic platforms are winning. We have dramatically improved
our Internet offerings. Our team knows that they must deliver great
content with digital distribution to their customers. NBCU should
grow earnings in 2007 and is well positioned for the future.
I would ask investors to think about the
progress we have made with our portfolio over
the last five years. In 2001, one-third of our
earnings were generated by businesses that
could not consistently hit our 10% earnings
growth and 20% return goals. Since then, we
have executed a disciplined portfolio strategy
to create a sustainable competitive advantage
based on technology, brand and a valuable
installed base. As we go forward, all of
our portfolio will be capable of delivering on
our financial goals. In addition, each of our
businesses can capitalize on the major growth
trends of this era.
6 ge 2006 annual report