GE 2006 Annual Report Download - page 103
Download and view the complete annual report
Please find page 103 of the 2006 GE annual report below. You can navigate through the pages in the report by either clicking on the pages listed below, or by using the keyword search tool below to find specific information within the annual report.-
 1
1 -
2
-
3
-
4
-
5
-
6
-
7
-
8
-
9
-
10
-
11
-
12
-
13
-
14
-
15
-
16
-
17
-
18
-
19
-
20
-
21
-
22
-
23
-
24
-
25
-
26
-
27
-
28
-
29
-
30
-
31
-
32
-
33
-
34
-
35
-
36
-
37
-
38
-
39
-
40
-
41
-
42
-
43
-
44
-
45
-
46
-
47
-
48
-
49
-
50
-
51
-
52
-
53
-
54
-
55
-
56
-
57
-
58
-
59
-
60
-
61
-
62
-
63
-
64
-
65
-
66
-
67
-
68
-
69
-
70
-
71
-
72
-
73
-
74
-
75
-
76
-
77
-
78
-
79
-
80
-
81
-
82
-
83
-
84
-
85
-
86
-
87
-
88
-
89
-
90
-
91
-
92
-
 93
93 -
 94
94 -
 95
95 -
 96
96 -
 97
97 -
 98
98 -
 99
99 -
 100
100 -
 101
101 -
 102
102 -
 103
103 -
 104
104 -
 105
105 -
 106
106 -
 107
107 -
 108
108 -
 109
109 -
 110
110 -
 111
111 -
 112
112 -
 113
113 -
114
-
115
-
116
-
117
-
118
-
119
-
120
 |
 |

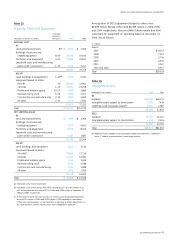
Note 27
Financial Instruments
2006 2005
Assets (liabilities) Assets (liabilities)
Notional Carrying Estimated Notional Carrying Estimated
December 31 (In millions) amount amount (net) fair value amount amount (net) fair value
GE
Assets
Investments and notes receivable $ (a) $ 494 $ 494 $ (a) $ 573 $ 625
Liabilities
Borrowings(b) (c) (a) (11,297) (11,204) (a) (10,208) (10,223)
GECS
Assets
Loans (a) 266,055 265,578 (a) 223,855 224,259
Other commercial and residential mortgages held for sale (a) 7,296 7,439 (a) 6,696 6,696
Other fi nancial instruments
(d) (a) 3,714 4,158 (a) 4,138 4,494
Liabilities
Borrowings
(b) (c) (a) (426,279) (432,275) (a) (362,069) (369,972)
Investment contract benefits (a) (5,089) (5,080) (a) (6,034) (6,020)
Insurance — credit life (e) 2,634 (81) (61) 2,365 (8) (8)
(a) These financial instruments do not have notional amounts.
(b) Included effects of interest rate and cross-currency swaps.
(c) See note 18.
(d) Principally cost method investments.
(e) Net of reinsurance of $840 million and $292 million at December 31, 2006 and 2005, respectively.
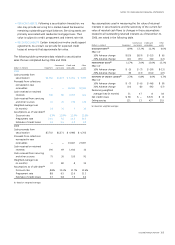
Assets and liabilities not carried at fair value in our Statement of
Financial Position are discussed below. Apart from certain of our
borrowings and certain marketable securities, few of the instru-
ments discussed below are actively traded and their fair values
must often be determined using financial models. Realization of
the fair value of these instruments depends upon market forces
beyond our control, including marketplace liquidity. Therefore,
the disclosed fair values may not be indicative of net realizable
value or reflect future fair values.
A description of how we estimate fair values follows.
Loans
Based on quoted market prices, recent transactions and/or dis-
counted future cash flows, using rates at which similar loans
would have been made to similar borrowers.
Borrowings
Based on discounted future cash flows using current market
rates which are comparable to market quotes.
Investment contract benefits
Based on expected future cash flows, discounted at currently
offered rates for immediate annuity contracts or cash surrender
values for single premium deferred annuities.
All other instruments
Based on comparable market transactions, discounted future
cash flows, quoted market prices, and/or estimates of the cost
to terminate or otherwise settle obligations. The fair values of
our cost method investments that are not exchange traded rep-
resent our best estimates of amounts we could have received
other than on a forced or liquidation basis.
Assets and liabilities that are reflected in the accompanying
financial statements at fair value are not included in the above
disclosures; such items include cash and equivalents, investment
securities and derivative fi nancial instruments.
Additional information about certain categories in the table
above follows.
Residential mortgages
Residential mortgage products amounting to $13,325 million
(23% of all residential mortgages) and $12,633 million (27% of all
residential mortgages) at December 31, 2006 and 2005, respectively,
were either high loan-to-value, those permitting interest-only
payments or those with below market introductory rates. We orig-
inate such loans either for our portfolio or for sale in secondary
markets. The portfolio was geographically diverse, with Europe
and North America the most significant market segments.
ge 2006 annual report 101