GE 2006 Annual Report Download - page 83
Download and view the complete annual report
Please find page 83 of the 2006 GE annual report below. You can navigate through the pages in the report by either clicking on the pages listed below, or by using the keyword search tool below to find specific information within the annual report.-
 1
1 -
2
-
3
-
4
-
5
-
6
-
7
-
8
-
9
-
10
-
11
-
12
-
13
-
14
-
15
-
16
-
17
-
18
-
19
-
20
-
21
-
22
-
23
-
24
-
25
-
26
-
27
-
28
-
29
-
30
-
31
-
32
-
33
-
34
-
35
-
36
-
37
-
38
-
39
-
40
-
41
-
42
-
43
-
44
-
45
-
46
-
47
-
48
-
49
-
50
-
51
-
52
-
53
-
54
-
55
-
56
-
57
-
58
-
59
-
60
-
61
-
62
-
63
-
64
-
65
-
66
-
67
-
68
-
69
-
70
-
71
-
72
-
 73
73 -
 74
74 -
 75
75 -
 76
76 -
 77
77 -
 78
78 -
 79
79 -
 80
80 -
 81
81 -
 82
82 -
 83
83 -
 84
84 -
 85
85 -
 86
86 -
 87
87 -
 88
88 -
 89
89 -
 90
90 -
 91
91 -
 92
92 -
 93
93 -
94
-
95
-
96
-
97
-
98
-
99
-
100
-
101
-
102
-
103
-
104
-
105
-
106
-
107
-
108
-
109
-
110
-
111
-
112
-
113
-
114
-
115
-
116
-
117
-
118
-
119
-
120
 |
 |

Trust assets invested in short-term securities must be
invested in securities rated A1/P1 or better, other than 15% of
short-term holdings which may be rated A2/P2. GE common
stock represented 6.1% of trust assets at year-end 2006 and
2005 and is subject to a statutory limit when it reaches 10% of
total trust assets.
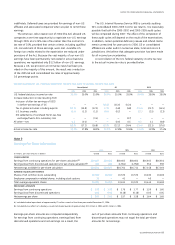
Our recorded balances for retiree benefit plans are as follows:
RETIREE BENEFIT ASSET (LIABILITY)
December 31 (In millions) 2006 2005
Funded status(a) $(6,552) $(7,465)
Unrecognized prior service cost (b) 2,409
Unrecognized net actuarial loss (b) 902
Net liability recognized $(6,552) $(4,154)
Liability recorded in the Statement of
Financial Position
Unfunded liabilities
Retiree health plans
Due within one year $ (681) $ (740)
Due after one year (5,320) (3,395)
Retiree life plans (551) (19)
Net liability recognized $(6,552) $(4,154)
Amounts recorded in shareowners’ equity
Prior service cost $ 2,046 $ —
Net actuarial loss 4 —
Total $ 2,050 $ —
(a) Fair value of assets less APBO, as shown in the preceding tables.
(b) Amounts recognized in shareowners’ equity in 2006 upon adoption of SFAS 158.
See note 1.
The estimated prior service cost and net actuarial loss for our
retiree benefit plans that will be amortized from shareowners’
equity into retiree benefit plans cost in 2007 are $290 million
and $10 million, respectively. Comparable amortized amounts
in 2006 were $363 million and $64 million, respectively.
Our estimated future benefit payments are as follows:
ESTIMATED FUTURE BENEFIT PAYMENTS
2012–
2016(In millions) 2007 2008 2009 2010 2011
Gross $935 $920 $880 $860 $840 $3,760
Expected Medicare
Part D subsidy 85 95 105 110 115 660
Net $850 $825 $775 $750 $725 $3,100
Our labor agreements with various U.S. unions expire in June
2007, and we will be engaged in negotiations to attain new
agreements. Results of 2007 negotiations cannot be predicted.
However, recent past negotiations have resulted in increased per
capita costs as well as a corresponding increase in our APBO.
There is no assurance that such increases pursuant to 2007
negotiations will be less than recent experience.
Note 7
Pension Benefits
We sponsor a number of pension plans. Principal pension plans,
together with affiliate and certain other pension plans (other
pension plans), detailed in this note, represent about 99% of our
total pension assets. We use a December 31 measurement date
for our plans.
PRINCIPAL PENSION PLANS are the GE Pension Plan and the GE
Supplementary Pension Plan.
The GE Pension Plan provides benefits to certain U.S. employees
based on the greater of a formula recognizing career earnings or
a formula recognizing length of service and final average earnings.
Certain benefit provisions are subject to collective bargaining.
The GE Supplementary Pension Plan is an unfunded plan
providing supplementary retirement benefits primarily to higher-
level, longer-service U.S. employees.
OTHER PENSION PLANS in 2006 included 27 U.S. and non-U.S.
pension plans with pension assets or obligations greater than
$50 million. These defi ned benefit plans provide benefi ts to
employees based on formulas recognizing length of service
and earnings.
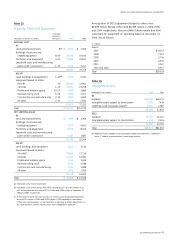
Effective December 31, 2006, we adopted SFAS 158,
Employers’ Accounting for Defi ned Benefit Pension and Other
Postretirement Plans. See note 1 for the incremental effects of
the initial adoption of SFAS 158 on our Statement of Financial
Position at December 31, 2006.
PENSION PLAN PARTICIPANTS
December 31, 2006 (In thousands) Total
Principal
pension
plans
Other
pension
plans
Active employees 179 135 44
Vested former employees 223 185 38
Retirees and benefi ciaries 233 210 23
Total 635 530 105
ge 2006 annual report 81