GE 2006 Annual Report Download - page 95
Download and view the complete annual report
Please find page 95 of the 2006 GE annual report below. You can navigate through the pages in the report by either clicking on the pages listed below, or by using the keyword search tool below to find specific information within the annual report.-
 1
1 -
2
-
3
-
4
-
5
-
6
-
7
-
8
-
9
-
10
-
11
-
12
-
13
-
14
-
15
-
16
-
17
-
18
-
19
-
20
-
21
-
22
-
23
-
24
-
25
-
26
-
27
-
28
-
29
-
30
-
31
-
32
-
33
-
34
-
35
-
36
-
37
-
38
-
39
-
40
-
41
-
42
-
43
-
44
-
45
-
46
-
47
-
48
-
49
-
50
-
51
-
52
-
53
-
54
-
55
-
56
-
57
-
58
-
59
-
60
-
61
-
62
-
63
-
64
-
65
-
66
-
67
-
68
-
69
-
70
-
71
-
72
-
73
-
74
-
75
-
76
-
77
-
78
-
79
-
80
-
81
-
82
-
83
-
84
-
 85
85 -
 86
86 -
 87
87 -
 88
88 -
 89
89 -
 90
90 -
 91
91 -
 92
92 -
 93
93 -
 94
94 -
 95
95 -
 96
96 -
 97
97 -
 98
98 -
 99
99 -
 100
100 -
 101
101 -
 102
102 -
 103
103 -
 104
104 -
 105
105 -
106
-
107
-
108
-
109
-
110
-
111
-
112
-
113
-
114
-
115
-
116
-
117
-
118
-
119
-
120
 |
 |

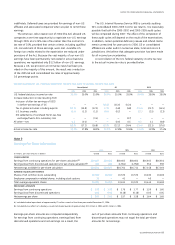
Note 17
All Other Assets
December 31 (In millions) 2006 2005
GE
Investments
Associated companies $ 1,729 $ 1,824
Other(a) 752 1,089
2,481 2,913
Prepaid pension asset — principal plans 15,019 17,853
Contract costs and estimated earnings 5,988 4,664
Film and television costs 3,646 3,828
Long-term receivables, including notes 2,908 2,790
Derivative instruments 193 247
Other 3,843 4,457
34,078 36,752
GECS
Investments
Real estate(b) 27,252 15,708
Assets held for sale(c) 12,524 8,574
Associated companies 12,053 13,481
Cost method
(d) 2,348 2,280
Other 931 1,330
55,108 41,373
Derivative instruments 1,982 1,556
Advances to suppliers 1,714 1,762
Deferred acquisition costs 1,380 1,471
Other 4,028 3,278
64,212 49,440
ELIMINATIONS (1,178) (1,364)
Total(e) $97,112 $84,828
(a) The fair value of and unrealized loss on cost method investments in a continuous
loss position in 2006 and 2005 were insignifi cant.
(b) GECS investment in real estate consisted principally of two categories: real estate
held for investment and equity method investments. Both categories contained
a wide range of properties including the following at December 31, 2006:
office buildings (54%), apartment buildings (16%), retail facilities (10%), industrial
properties (5%), parking facilities (4%), franchise properties (2%) and other (9%). At
December 31, 2006, investments were located in North America (39%), Europe
(37%) and Asia (24%).
(c) Assets were classified as held for sale on the date a decision was made to dispose
of them through sale, securitization or other means. Such assets consisted primar-
ily of real estate properties and mortgage and credit card receivables, and were
accounted for at the lower of carrying amount or estimated fair value less costs
to sell.
(d) The fair value of and unrealized loss on those investments in a continuous loss
position for less than 12 months in 2006 were $113 million and $25 million,
respectively. The fair value of and unrealized loss on those investments in a
continuous loss position for 12 months or more in 2006 were $38 million and
$8 million, respectively. The fair value of and unrealized loss on those investments
in a continuous loss position for less than 12 months in 2005 were $100 million
and $31 million, respectively. The fair value of and unrealized loss on those
investments in a continuous loss position for 12 months or more in 2005 were
$22 million and $9 million, respectively.
(e) Included $98 million in 2006 and $1,235 million in 2005 related to consolidated,
liquidating securitization entities. See note 28.
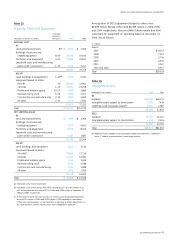
Note 18
Borrowings
SHORT-TERM BORROWINGS
2006
December 31 (Dollars in millions) (a)
Average rateAmount
2005
(a)
Average rateAmount
GE
Commercial paper
U.S. $ 1,097 5.35% $ 497 4.40%
Non-U.S. 1 3.74 1 2.85
Payable to banks 319 5.61 358 3.99
Current portion of
long-term debt 32 5.32 129 4.84
Other 763 142
2,212 1,127
GECS
Commercial paper
U.S.
Unsecured
Asset-backed(b)
67,423
6,430
5.37
5.35
67,643
9,267
4.30
4.21
Non-U.S. 26,328 4.38 20,456 3.47
Current portion of
long-term debt(c)(d)
GE Interest Plus notes
(e)
44,553
9,161
4.86
5.43
41,792
7,708
4.05
4.35
Other 19,421 10,806
173,316 157,672
ELIMINATIONS (3,375) (643)
Total $172,153 $158,156
(a) Based on year-end balances and year-end local currency interest rates. Current
portion of long-term debt included the effects of related interest rate and currency
swaps, if any, directly associated with the original debt issuance.
(b) Entirely obligations of consolidated, liquidating securitization entities. See note 28.
(c) Included short-term borrowings by consolidated, liquidating securitization entities
of $697 million at December 31, 2005, which matured in 2006. See note 28.
(d) Included $250 million of subordinated notes guaranteed by GE at December 31,
2005, which matured in 2006.
(e) Entirely variable denomination floating rate notes.
ge 2006 annual report 93