Kohl's 2012 Annual Report Download - page 15
Download and view the complete annual report
Please find page 15 of the 2012 Kohl's annual report below. You can navigate through the pages in the report by either clicking on the pages listed below, or by using the keyword search tool below to find specific information within the annual report.-
 1
1 -
2
-
3
-
4
-
 5
5 -
 6
6 -
 7
7 -
 8
8 -
 9
9 -
 10
10 -
 11
11 -
 12
12 -
 13
13 -
 14
14 -
 15
15 -
 16
16 -
 17
17 -
 18
18 -
 19
19 -
 20
20 -
 21
21 -
 22
22 -
 23
23 -
 24
24 -
 25
25 -
26
-
27
-
28
-
29
-
30
-
31
-
32
-
33
-
34
-
35
-
36
-
37
-
38
-
39
-
40
-
41
-
42
-
43
-
44
-
45
-
46
-
47
-
48
-
49
-
50
-
51
-
52
-
53
-
54
-
55
-
56
-
57
-
58
-
59
-
60
-
61
-
62
-
63
-
64
-
65
-
66
-
67
-
68
-
69
-
70
-
71
-
72
-
73
-
74
-
75
-
76
-
77
-
78
-
79
-
80
-
81
-
82
-
83
-
84
-
85
-
86
-
87
-
88
-
89
-
90
-
91
-
92
-
93
-
94
-
95
-
96
-
97
-
98
-
99
-
100
-
101
-
102
-
103
-
104
-
105
-
106
-
107
-
108
-
109
-
110
-
111
-
112
-
113
-
114
-
115
-
116
-
117
-
118
-
119
-
120
-
121
-
122
-
123
-
124
-
125
-
126
-
127
-
128
-
129
-
130
-
131
-
132
-
133
-
134
-
135
-
136
-
137
-
138
-
139
-
140
-
141
-
142
-
143
-
144
-
145
-
146
-
147
-
148
-
149
-
150
-
151
-
152
-
153
-
154
-
155
-
156
-
157
-
158
-
159
-
160
-
161
-
162
-
163
-
164
 |
 |

15
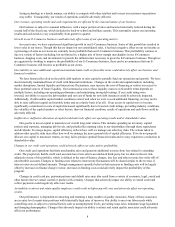
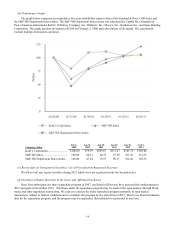
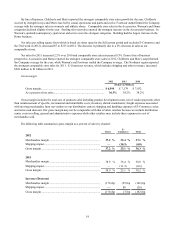
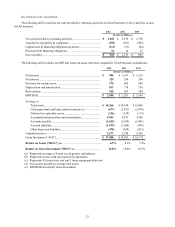
The following table contains information for shares repurchased and shares acquired from employees in lieu of amounts
required to satisfy minimum tax withholding requirements upon the vesting of the employees’ restricted stock during the three
fiscal months ended February 2, 2013:
Period
Total
Number
of Shares
Purchased
During
Period
Average
Price
Paid Per
Share
Total Number
of Shares
Purchased as
Part of
Publicly
Announced
Plans or
Programs
Approximate
Dollar Value
of
Shares that
May Yet Be
Purchased
Under the
Plans or
Programs
(In Millions)
October 28 – November 24, 2012........................ 1,375,849 $ 52.23 1,373,900 $ 3,445
November 25 – December 29, 2012..................... 3,884,107 44.06 3,882,828 3,274
December 30, 2012 – February 2, 2013............... 3,584,989 42.72 3,584,364 3,121
Total...................................................................... 8,844,945 $ 44.79 8,841,092 $ 3,121