Kohl's 2012 Annual Report Download - page 16
Download and view the complete annual report
Please find page 16 of the 2012 Kohl's annual report below. You can navigate through the pages in the report by either clicking on the pages listed below, or by using the keyword search tool below to find specific information within the annual report.-
 1
1 -
2
-
3
-
4
-
5
-
 6
6 -
 7
7 -
 8
8 -
 9
9 -
 10
10 -
 11
11 -
 12
12 -
 13
13 -
 14
14 -
 15
15 -
 16
16 -
 17
17 -
 18
18 -
 19
19 -
 20
20 -
 21
21 -
 22
22 -
 23
23 -
 24
24 -
 25
25 -
 26
26 -
27
-
28
-
29
-
30
-
31
-
32
-
33
-
34
-
35
-
36
-
37
-
38
-
39
-
40
-
41
-
42
-
43
-
44
-
45
-
46
-
47
-
48
-
49
-
50
-
51
-
52
-
53
-
54
-
55
-
56
-
57
-
58
-
59
-
60
-
61
-
62
-
63
-
64
-
65
-
66
-
67
-
68
-
69
-
70
-
71
-
72
-
73
-
74
-
75
-
76
-
77
-
78
-
79
-
80
-
81
-
82
-
83
-
84
-
85
-
86
-
87
-
88
-
89
-
90
-
91
-
92
-
93
-
94
-
95
-
96
-
97
-
98
-
99
-
100
-
101
-
102
-
103
-
104
-
105
-
106
-
107
-
108
-
109
-
110
-
111
-
112
-
113
-
114
-
115
-
116
-
117
-
118
-
119
-
120
-
121
-
122
-
123
-
124
-
125
-
126
-
127
-
128
-
129
-
130
-
131
-
132
-
133
-
134
-
135
-
136
-
137
-
138
-
139
-
140
-
141
-
142
-
143
-
144
-
145
-
146
-
147
-
148
-
149
-
150
-
151
-
152
-
153
-
154
-
155
-
156
-
157
-
158
-
159
-
160
-
161
-
162
-
163
-
164
 |
 |

16
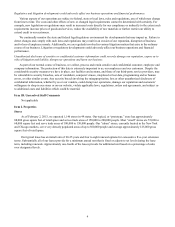
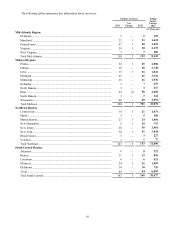
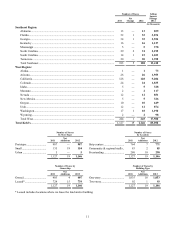
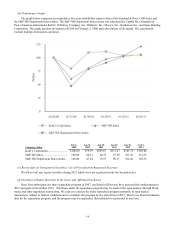
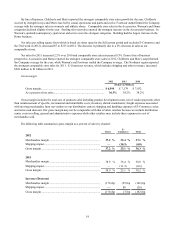
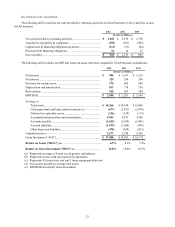
Item 6. Selected Consolidated Financial Data
The selected consolidated financial data presented below should be read in conjunction with our consolidated financial
statements and related notes included elsewhere in this document. The Statement of Income and Balance Sheet Data have been
derived from our audited consolidated financial statements.
2012(a) 2011 2010 2009 2008
(Dollars in Millions, Except Per Share and Per Square Foot Data)
Statement of Income Data:
Net sales............................................................................................ $19,279 $18,804 $18,391 $17,178 $16,389
Cost of merchandise sold.................................................................. 12,289 11,625 11,359 10,680 10,334
Gross margin..................................................................................... 6,990 7,179 7,032 6,498 6,055
Selling, general and administrative expenses ................................... 4,267 4,243 4,190 3,951 3,769
Depreciation and amortization.......................................................... 833 778 750 688 632
Operating income.............................................................................. 1,890 2,158 2,092 1,859 1,654
Interest expense, net.......................................................................... 329 299 304 301 275
Income before income taxes ............................................................. 1,561 1,859 1,788 1,558 1,379
Provision for income taxes................................................................ 575 692 668 585 522
Net income........................................................................................ $ 986 $ 1,167 $ 1,120 $ 973 $ 857
Net income per share:
Basic........................................................................................... $ 4.19 $ 4.33 $ 3.69 $ 3.19 $ 2.80
Diluted........................................................................................ $ 4.17 $ 4.30 $ 3.66 $ 3.17 $ 2.80
Dividends per share........................................................................... $ 1.28 $ 1.00 — — —
Operating Data:
Net sales growth................................................................................ 2.5% 2.2% 7.1% 4.8% (0.5)%
Comparable store sales growth (b).................................................... 0.3% 0.5% 4.4% 0.4% (6.9)%
Net sales per selling square foot (c).................................................. $ 213 $ 220 $ 222 $ 217 $ 222
As a percent of sales:
Gross margin.............................................................................. 36.3% 38.2% 38.2% 37.8% 36.9 %
Operating income....................................................................... 9.8% 11.5% 11.4% 10.8% 10.1 %
Net income................................................................................. 5.1% 6.2% 6.1% 5.7% 5.2 %
Total square feet of selling space (in thousands) .............................. 83,098 82,226 80,139 78,396 74,992
Number of stores open (end of period) ............................................. 1,146 1,127 1,089 1,058 1,004
Return on average shareholders’ equity (d) ...................................... 15.8% 16.4% 14.1% 13.8% 13.8 %
Balance Sheet Data (end of period):
Working capital................................................................................. $ 2,184 $ 2,222 $ 2,888 $ 3,054 $ 1,849
Property and equipment, net ............................................................. 8,872 8,905 8,692 8,506 8,402
Total assets........................................................................................ 13,905 14,148 14,891 14,502 12,620
Long-term debt .................................................................................. 2,492 2,141 1,894 1,894 1,893
Capital lease and financing obligations ............................................ 2,061 2,103 2,104 2,046 1,914
Shareholders’ equity.......................................................................... 6,048 6,508 7,850 7,595 6,499
(a) The retail calendar for fiscal January 2013 included a fifth week, resulting in a 53-week year. During this 53rd week, total
sales were $169 million; selling, general and administrative expenses were approximately $30 million; interest was
approximately $2 million; net income was approximately $15 million and diluted earnings per share was approximately
$0.06.
(b) Comparable store sales growth is based on sales for stores (including relocated or remodeled stores) which were open
throughout both the full current and prior year periods and E-Commerce. Fiscal 2012 comparable store sales growth
compares the 52 weeks ended January 26, 2013 to the 52 weeks ended January 28, 2012.
(c) Net sales per selling square foot is based on stores open for the full current period, excluding E-Commerce. 2012 excludes
the impact of the 53rd week.
(d) Average shareholders’ equity is based on a 5-quarter average for 2012, 2011, and 2010, and the two most recent year-end
balances for 2009 and 2008.