Kohl's 2012 Annual Report Download - page 53
Download and view the complete annual report
Please find page 53 of the 2012 Kohl's annual report below. You can navigate through the pages in the report by either clicking on the pages listed below, or by using the keyword search tool below to find specific information within the annual report.-
 1
1 -
2
-
3
-
4
-
5
-
6
-
7
-
8
-
9
-
10
-
11
-
12
-
13
-
14
-
15
-
16
-
17
-
18
-
19
-
20
-
21
-
22
-
23
-
24
-
25
-
26
-
27
-
28
-
29
-
30
-
31
-
32
-
33
-
34
-
35
-
36
-
37
-
38
-
39
-
40
-
41
-
42
-
 43
43 -
 44
44 -
 45
45 -
 46
46 -
 47
47 -
 48
48 -
 49
49 -
 50
50 -
 51
51 -
 52
52 -
 53
53 -
 54
54 -
 55
55 -
 56
56 -
 57
57 -
 58
58 -
 59
59 -
 60
60 -
 61
61 -
 62
62 -
 63
63 -
64
-
65
-
66
-
67
-
68
-
69
-
70
-
71
-
72
-
73
-
74
-
75
-
76
-
77
-
78
-
79
-
80
-
81
-
82
-
83
-
84
-
85
-
86
-
87
-
88
-
89
-
90
-
91
-
92
-
93
-
94
-
95
-
96
-
97
-
98
-
99
-
100
-
101
-
102
-
103
-
104
-
105
-
106
-
107
-
108
-
109
-
110
-
111
-
112
-
113
-
114
-
115
-
116
-
117
-
118
-
119
-
120
-
121
-
122
-
123
-
124
-
125
-
126
-
127
-
128
-
129
-
130
-
131
-
132
-
133
-
134
-
135
-
136
-
137
-
138
-
139
-
140
-
141
-
142
-
143
-
144
-
145
-
146
-
147
-
148
-
149
-
150
-
151
-
152
-
153
-
154
-
155
-
156
-
157
-
158
-
159
-
160
-
161
-
162
-
163
-
164
 |
 |

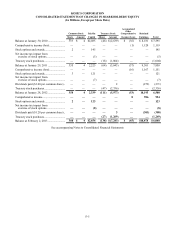
KOHL’S CORPORATION
NOTES TO CONSOLIDATED FINANCIAL STATEMENTS—(Continued)
F-14
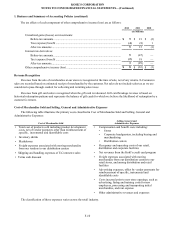
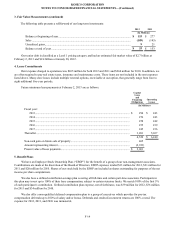
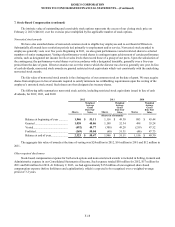
3. Fair Value Measurements (continued)
The following table presents a rollforward of our long-term investments:
2012 2011
(In Millions)
Balance at beginning of year..................................................................................................... $ 153 $ 277
Sales .......................................................................................................................................... (109)(145)
Unrealized gains........................................................................................................................ 921
Balance at end of year............................................................................................................... $ 53 $ 153
Our senior debt is classified as a Level 1 pricing category and had an estimated fair market value of $2.7 billion at
February 2, 2013 and $2.4 billion at January 28, 2012.
4. Lease Commitments
Rent expense charged to operations was $265 million for both 2012 and 2011 and $264 million for 2010. In addition, we
are often required to pay real estate taxes, insurance and maintenance costs. These items are not included in the rent expenses
listed above. Many store leases include multiple renewal options, exercisable at our option, that generally range from four to
eight additional five-year periods.
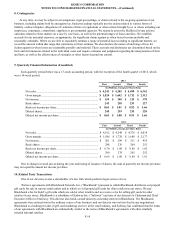
Future minimum lease payments at February 2, 2013 are as follows:
Capital
Lease
and
Financing
Obligations Operating
Leases
(In Millions)
Fiscal year:
2013.................................................................................................................................... $ 294 $ 243
2014.................................................................................................................................... 276 243
2015.................................................................................................................................... 258 242
2016.................................................................................................................................... 255 239
2017.................................................................................................................................... 245 236
Thereafter.................................................................................................................................. 3,201 5,037
4,529 $ 6,240
Non-cash gain on future sale of property.................................................................................. 465
Amount representing interest.................................................................................................... (2,933)
Present value of lease payments................................................................................................ $ 2,061
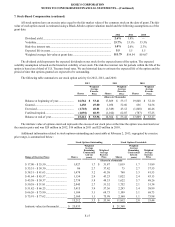
5. Benefit Plans
We have an Employee Stock Ownership Plan (“ESOP”) for the benefit of a group of our non-management associates.
Contributions are made at the discretion of the Board of Directors. ESOP expenses totaled $13 million for 2012, $21 million for
2011 and $20 million for 2010. Shares of our stock held by the ESOP are included as shares outstanding for purposes of the net
income per share computations.
We also have a defined contribution savings plan covering all full-time and certain part-time associates. Participants in
this plan may invest up to 100% of their base compensation, subject to certain statutory limits. We match 100% of the first 5%
of each participant’s contribution. Defined contribution plan expense, net of forfeitures, was $39 million for 2012, $36 million
for 2011 and $34 million for 2010.
We also offer a non-qualified deferred compensation plan to a group of executives which provides for pre-tax
compensation deferrals up to 100% of salary and/or bonus. Deferrals and credited investment returns are 100% vested. The
expense for 2012, 2011, and 2010 was immaterial.