Kohl's 2012 Annual Report Download - page 21
Download and view the complete annual report
Please find page 21 of the 2012 Kohl's annual report below. You can navigate through the pages in the report by either clicking on the pages listed below, or by using the keyword search tool below to find specific information within the annual report.-
 1
1 -
2
-
3
-
4
-
5
-
6
-
7
-
8
-
9
-
10
-
 11
11 -
 12
12 -
 13
13 -
 14
14 -
 15
15 -
 16
16 -
 17
17 -
 18
18 -
 19
19 -
 20
20 -
 21
21 -
 22
22 -
 23
23 -
 24
24 -
 25
25 -
 26
26 -
 27
27 -
 28
28 -
 29
29 -
 30
30 -
 31
31 -
32
-
33
-
34
-
35
-
36
-
37
-
38
-
39
-
40
-
41
-
42
-
43
-
44
-
45
-
46
-
47
-
48
-
49
-
50
-
51
-
52
-
53
-
54
-
55
-
56
-
57
-
58
-
59
-
60
-
61
-
62
-
63
-
64
-
65
-
66
-
67
-
68
-
69
-
70
-
71
-
72
-
73
-
74
-
75
-
76
-
77
-
78
-
79
-
80
-
81
-
82
-
83
-
84
-
85
-
86
-
87
-
88
-
89
-
90
-
91
-
92
-
93
-
94
-
95
-
96
-
97
-
98
-
99
-
100
-
101
-
102
-
103
-
104
-
105
-
106
-
107
-
108
-
109
-
110
-
111
-
112
-
113
-
114
-
115
-
116
-
117
-
118
-
119
-
120
-
121
-
122
-
123
-
124
-
125
-
126
-
127
-
128
-
129
-
130
-
131
-
132
-
133
-
134
-
135
-
136
-
137
-
138
-
139
-
140
-
141
-
142
-
143
-
144
-
145
-
146
-
147
-
148
-
149
-
150
-
151
-
152
-
153
-
154
-
155
-
156
-
157
-
158
-
159
-
160
-
161
-
162
-
163
-
164
 |
 |

21
Marketing costs as a percent of sales for 2012 were comparable to the prior year as 2011 included expenses to support the
Jennifer Lopez and Marc Anthony brand launches - the largest launches in our history. The 53rd week in 2012 also had a
positive impact on marketing costs as a percent of sales.
SG&A for 2011 increased $53 million, or 1%, over 2010, but decreased as a percentage of net sales. SG&A increased
primarily due to store growth, increased advertising, and investments in technology and infrastructure related to our E-
Commerce business. These increases were partially offset by higher revenues in our credit card portfolio due to higher average
receivables and a more favorable revenue sharing percentage under our April 2011 agreement with Capital One, National
Association ("Capital One").
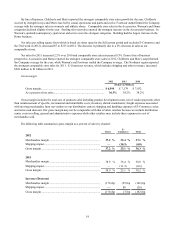
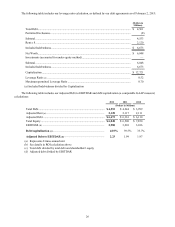
Other Expenses.
2012 2011 2010
(In Millions)
Depreciation and amortization ............................................................ $ 833 $ 778 $ 750
Interest expense, net ............................................................................ 329 299 304
Provision for income taxes.................................................................. 575 692 668
Effective tax rate.................................................................................. 36.8% 37.2% 37.4%
The increases in depreciation and amortization are primarily due to recent computer software and hardware additions
which have a short amortization period as well as the addition of new stores, remodels and the opening of our fourth E-
Commerce fulfillment center in DeSoto, Texas.
Net interest expense, including $2 million in the 53rd week of 2012, increased $30 million, or 10%, over 2011. The
increase in interest expense is primarily due to the net increase in our outstanding long-term debt. Net interest expense for
2011 decreased $5 million from 2010. The decrease was attributable to the repayment of debt totaling $400 million in March
and October 2011 and the subsequent issuance of $650 million of debt in October 2011 at a lower interest rate.
The decrease in the effective tax rate for 2012 was primarily due to favorable settlements of state tax audits in the first six
months of the year.
Inflation
Although we expect that our operations will be influenced by general economic conditions, including rising food, fuel
and energy prices, we do not believe that inflation has had a material effect on our results of operations. However, there can be
no assurance that our business will not be affected by such factors in the future. We experienced 10-15% increases in apparel
costs in 2011. In 2012, we saw modest increases in apparel costs in the first six months and mid-single-digit decreases in the
last six months of the year. In 2013, we expect to see modest decreases in apparel costs.
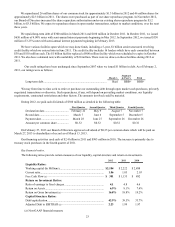
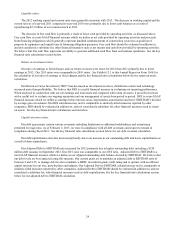
Liquidity and Capital Resources
Our primary ongoing cash requirements are for capital expenditures for new stores, remodels and IT spending and for
seasonal and new store inventory purchases. Share repurchases and dividend payments to shareholders are currently other
significant usages of cash. These payments are discretionary and can be discontinued at any time should we require cash for
other uses. Our primary sources of funds are cash flow provided by operations, short-term trade credit and our lines of credit.
Short-term trade credit, in the form of extended payment terms for inventory purchases, often represents a significant source of
financing for merchandise inventories. Seasonal cash needs may be met by cash on hand and/or the line of credit available
under our revolving credit facility. Our working capital and inventory levels typically build throughout the fall, peaking during
the November and December holiday selling season.
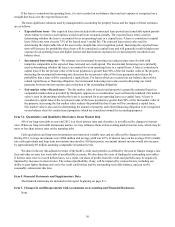
As of February 2, 2013, we had cash and cash equivalents of $537 million. We generated $381 million of free cash flow
in 2012. (See the Free Cash Flow discussion later in this Liquidity and Capital Resources section for additional discussion of
this non-GAAP financial measure.)
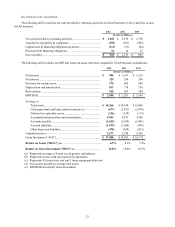
2012 2011 2010
(In Millions)
Net cash provided by (used in):
Operating activities.............................................................................. $ 1,265 $ 2,139 $ 1,750
Investing activities............................................................................... (660)(802)(757)
Financing activities.............................................................................. (1,273)(2,409)(983)