Kohl's 2012 Annual Report Download - page 24
Download and view the complete annual report
Please find page 24 of the 2012 Kohl's annual report below. You can navigate through the pages in the report by either clicking on the pages listed below, or by using the keyword search tool below to find specific information within the annual report.-
 1
1 -
2
-
3
-
4
-
5
-
6
-
7
-
8
-
9
-
10
-
11
-
12
-
13
-
 14
14 -
 15
15 -
 16
16 -
 17
17 -
 18
18 -
 19
19 -
 20
20 -
 21
21 -
 22
22 -
 23
23 -
 24
24 -
 25
25 -
 26
26 -
 27
27 -
 28
28 -
 29
29 -
 30
30 -
 31
31 -
 32
32 -
 33
33 -
 34
34 -
35
-
36
-
37
-
38
-
39
-
40
-
41
-
42
-
43
-
44
-
45
-
46
-
47
-
48
-
49
-
50
-
51
-
52
-
53
-
54
-
55
-
56
-
57
-
58
-
59
-
60
-
61
-
62
-
63
-
64
-
65
-
66
-
67
-
68
-
69
-
70
-
71
-
72
-
73
-
74
-
75
-
76
-
77
-
78
-
79
-
80
-
81
-
82
-
83
-
84
-
85
-
86
-
87
-
88
-
89
-
90
-
91
-
92
-
93
-
94
-
95
-
96
-
97
-
98
-
99
-
100
-
101
-
102
-
103
-
104
-
105
-
106
-
107
-
108
-
109
-
110
-
111
-
112
-
113
-
114
-
115
-
116
-
117
-
118
-
119
-
120
-
121
-
122
-
123
-
124
-
125
-
126
-
127
-
128
-
129
-
130
-
131
-
132
-
133
-
134
-
135
-
136
-
137
-
138
-
139
-
140
-
141
-
142
-
143
-
144
-
145
-
146
-
147
-
148
-
149
-
150
-
151
-
152
-
153
-
154
-
155
-
156
-
157
-
158
-
159
-
160
-
161
-
162
-
163
-
164
 |
 |
24
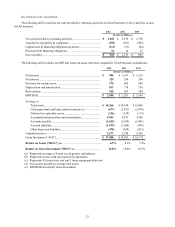
Liquidity ratios.
The 2012 working capital and current ratio were generally consistent with 2011. The decrease in working capital and the
current ratio as of year-end 2011 compared to year-end 2010 were primarily due to lower cash balances as a result of
repurchasing $2.3 billion of our common stock in 2011.
The decrease in free cash flow is primarily a result of lower cash provided by operating activities, as discussed above.
Free cash flow is a non-GAAP financial measure which we define as net cash provided by operating activities and proceeds
from financing obligations (which generally represent landlord reimbursements of construction costs) less acquisition of
property & equipment and capital lease & financing obligation payments. Free cash flow should be evaluated in addition to,
and not considered a substitute for, other financial measures such as net income and cash flow provided by operating activities.
We believe that free cash flow represents our ability to generate additional cash flow from our business operations. See the key
financial ratio calculations section below.
Return on investment ratios.
Our ratio of earnings to fixed charges and our return on assets were lower for 2012 than 2011 primarily due to lower
earnings in 2012. Our 2011 ratios were comparable to 2010 ratios. See Exhibit 12.1 to this Annual Report on Form 10-K for
the calculation of our ratio of earnings to fixed charges and the key financial ratio calculations below for the return on assets
calculation.
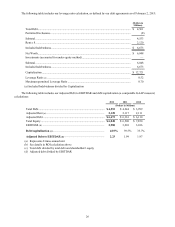
Our Return on Gross Investment (“ROI”) has decreased as investments in stores, distribution centers and technology
increased more than profitability. We believe that ROI is a useful financial measure in evaluating our operating performance.
When analyzed in conjunction with our net earnings and total assets and compared with return on assets, it provides investors
with a useful tool to evaluate our ongoing operations and our management of assets from period to period. ROI is a non-GAAP
financial measure which we define as earnings before interest, taxes, depreciation, amortization and rent (“EBITDAR”) divided
by average gross investment. Our ROI calculation may not be comparable to similarly-titled measures reported by other
companies. ROI should be evaluated in addition to, and not considered a substitute for, other financial measures such as return
on assets. See the key financial ratio calculations section below.
Capital structure ratios.
Our debt agreements contain various covenants including limitations on additional indebtedness and a maximum
permitted leverage ratio. As of February 2, 2013, we were in compliance with all debt covenants and expect to remain in
compliance during fiscal 2013. See the key financial ratio calculations section below for our debt covenant calculation.
Our debt/capitalization ratio has increased primarily due to an increase in our outstanding debt and lower capitalization as
a result of share repurchases.
Our Adjusted Debt to EBITDAR ratio increased for 2012 primarily due to higher outstanding debt, including a $350
million debt issuance in September 2012. Our 2011 ratio was comparable to our 2010 ratio. Adjusted Debt to EBITDAR is a
non-GAAP financial measure which we define as our adjusted outstanding debt balance divided by EBITDAR. We believe that
our debt levels are best analyzed using this measure. Our current goals are to maintain an adjusted debt to EBITDAR ratio of
between 2 and 2.25, to manage debt levels to maintain a BBB+ investment-grade credit rating and to operate with an efficient
capital structure for our size, growth plans and industry. Our Adjusted Debt to EBITDAR calculation may not be comparable to
similarly-titled measures reported by other companies. Adjusted Debt to EBITDAR should be evaluated in addition to, and not
considered a substitute for, other financial measures such as debt/capitalization. See the key financial ratio calculations section
below for our adjusted debt to EBITDAR calculation.