Kohl's 2012 Annual Report Download - page 18
Download and view the complete annual report
Please find page 18 of the 2012 Kohl's annual report below. You can navigate through the pages in the report by either clicking on the pages listed below, or by using the keyword search tool below to find specific information within the annual report.-
 1
1 -
2
-
3
-
4
-
5
-
6
-
7
-
 8
8 -
 9
9 -
 10
10 -
 11
11 -
 12
12 -
 13
13 -
 14
14 -
 15
15 -
 16
16 -
 17
17 -
 18
18 -
 19
19 -
 20
20 -
 21
21 -
 22
22 -
 23
23 -
 24
24 -
 25
25 -
 26
26 -
 27
27 -
 28
28 -
29
-
30
-
31
-
32
-
33
-
34
-
35
-
36
-
37
-
38
-
39
-
40
-
41
-
42
-
43
-
44
-
45
-
46
-
47
-
48
-
49
-
50
-
51
-
52
-
53
-
54
-
55
-
56
-
57
-
58
-
59
-
60
-
61
-
62
-
63
-
64
-
65
-
66
-
67
-
68
-
69
-
70
-
71
-
72
-
73
-
74
-
75
-
76
-
77
-
78
-
79
-
80
-
81
-
82
-
83
-
84
-
85
-
86
-
87
-
88
-
89
-
90
-
91
-
92
-
93
-
94
-
95
-
96
-
97
-
98
-
99
-
100
-
101
-
102
-
103
-
104
-
105
-
106
-
107
-
108
-
109
-
110
-
111
-
112
-
113
-
114
-
115
-
116
-
117
-
118
-
119
-
120
-
121
-
122
-
123
-
124
-
125
-
126
-
127
-
128
-
129
-
130
-
131
-
132
-
133
-
134
-
135
-
136
-
137
-
138
-
139
-
140
-
141
-
142
-
143
-
144
-
145
-
146
-
147
-
148
-
149
-
150
-
151
-
152
-
153
-
154
-
155
-
156
-
157
-
158
-
159
-
160
-
161
-
162
-
163
-
164
 |
 |

18
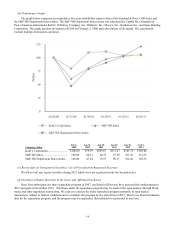
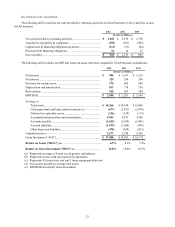
Net sales.
2012 2011 2010
Net sales (In Millions)....................................................................... $19,279 $18,804 $18,391
Sales growth:
Total............................................................................................ 2.5% 2.2% 7.1%
Comparable stores (a)................................................................. 0.3% 0.5% 4.4%
Net sales per selling square foot (b) .................................................. $ 213 $ 220 $ 222
(a) Includes sales for stores (including relocated or remodeled stores) which were open throughout both the full
current and prior year periods and E-Commerce. Fiscal 2012 comparable store sales growth compares the 52 weeks
ended January 26, 2013 to the 52 weeks ended January 28, 2012.
(b) Net sales per selling square foot is based on stores open for the full current period, excluding E-Commerce. 2012
excludes the impact of the 53rd week.
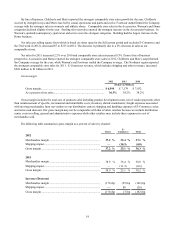
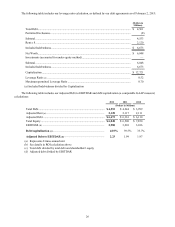
The changes in net sales were due to the following:
2012 2011
$%$ %
(Dollars in Millions)
Comparable store sales:
Stores............................................................................... $(354)(2.0)% $(175) (1.0)%
E-Commerce (a) .............................................................. 411 41.8 % 267 37.2
Total (b) ........................................................................... 57 0.3 % 92 0.5
New stores and other revenues ............................................... 249 — 321 —
Net change before 53rd week ................................................. 306 1.6 % 413 2.2 %
Sales in 53rd week.................................................................. 169 — — —
Increase in net sales ................................................................ $ 475 2.5 % $ 413 2.2 %
(a) Excludes shipping and other revenues
(b) Fiscal 2012 comparable store sales growth compares the 52 weeks ended January 26, 2013 to the 52 weeks ended
January 28, 2012.
Drivers of the changes in comparable store sales were as follows:
2012 2011
Selling price per unit ................................................................................................. 1.8% 6.6%
Units per transaction.................................................................................................. —(4.9)
Average transaction value.......................................................................................... 1.8 1.7
Number of transactions.............................................................................................. (1.5) (1.2)
Comparable store sales.............................................................................................. 0.3% 0.5%
The increases in selling price per unit are the result of changes in our pricing strategy. During the Fall of 2011, we
increased our prices as we passed higher apparel costs on to our customers. During 2012, we reduced our prices, especially in
the fourth quarter as sales were below expectations, but prices remained higher than 2011. Units per transaction was flat in
2012 and number of transactions declined in part due to insufficient inventory levels in the first several months of 2012 to meet
the sales demand which resulted from the price reductions.
From a regional perspective, all regions were slightly negative for the year with no significant variations between the
regions. E-Commerce revenue, which includes shipping and other revenues and the 53rd week, increased $432 million to $1.4
billion for 2012. The increase is primarily due to increased transactions.
Private and exclusive brand penetration increased approximately 160 basis points to 52% of sales for the year. Most of the
penetration increase was a result of recently-added exclusive brands, including Jennifer Lopez, Marc Anthony, and Rock &
Republic. FILA Sport and LC Lauren Conrad also reported significantly higher sales and contributed to the increased
penetration.