Kohl's 2012 Annual Report Download - page 20
Download and view the complete annual report
Please find page 20 of the 2012 Kohl's annual report below. You can navigate through the pages in the report by either clicking on the pages listed below, or by using the keyword search tool below to find specific information within the annual report.-
 1
1 -
2
-
3
-
4
-
5
-
6
-
7
-
8
-
9
-
 10
10 -
 11
11 -
 12
12 -
 13
13 -
 14
14 -
 15
15 -
 16
16 -
 17
17 -
 18
18 -
 19
19 -
 20
20 -
 21
21 -
 22
22 -
 23
23 -
 24
24 -
 25
25 -
 26
26 -
 27
27 -
 28
28 -
 29
29 -
 30
30 -
31
-
32
-
33
-
34
-
35
-
36
-
37
-
38
-
39
-
40
-
41
-
42
-
43
-
44
-
45
-
46
-
47
-
48
-
49
-
50
-
51
-
52
-
53
-
54
-
55
-
56
-
57
-
58
-
59
-
60
-
61
-
62
-
63
-
64
-
65
-
66
-
67
-
68
-
69
-
70
-
71
-
72
-
73
-
74
-
75
-
76
-
77
-
78
-
79
-
80
-
81
-
82
-
83
-
84
-
85
-
86
-
87
-
88
-
89
-
90
-
91
-
92
-
93
-
94
-
95
-
96
-
97
-
98
-
99
-
100
-
101
-
102
-
103
-
104
-
105
-
106
-
107
-
108
-
109
-
110
-
111
-
112
-
113
-
114
-
115
-
116
-
117
-
118
-
119
-
120
-
121
-
122
-
123
-
124
-
125
-
126
-
127
-
128
-
129
-
130
-
131
-
132
-
133
-
134
-
135
-
136
-
137
-
138
-
139
-
140
-
141
-
142
-
143
-
144
-
145
-
146
-
147
-
148
-
149
-
150
-
151
-
152
-
153
-
154
-
155
-
156
-
157
-
158
-
159
-
160
-
161
-
162
-
163
-
164
 |
 |

20
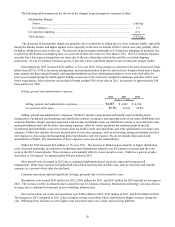
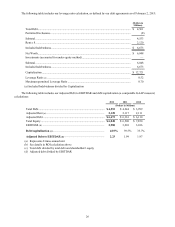
The following table summarizes the drivers of the changes in gross margin as a percent of sales:
Merchandise Margin:
Stores .............................................................................................................................. (168) bp
E-Commerce................................................................................................................... (7)
E-Commerce shipping .......................................................................................................... (17)
Total decrease ....................................................................................................................... (192) bp
The decreases in merchandise margin are primarily due to reductions in selling price to drive customer traffic, especially
during the holiday season, and higher apparel costs, especially in the first six months of 2012, which were only partially offset
by higher selling prices early in the year. The decrease in gross margin attributable to E-Commerce shipping are primarily due
to growth in this business as shipping losses as a percent of sales were lower in 2012 than in 2011. Our E-Commerce business
currently has a lower gross margin than our stores due to the mix of products sold on-line and free or related shipping
promotions. As our E-Commerce business grows, it also has a more significant impact on our overall gross margin results.
Gross margin for 2011 increased $147 million, or 2%, over 2010. Gross margin as a percent of net sales decreased 6 basis
points from 2011 to 2010 as inventory management, increased penetration of private and exclusive brands (which have a higher
gross margin rate than national brands), and ongoing markdown and size optimization initiatives were more than offset by
lower gross margin during the fourth quarter holiday season due to the extremely competitive landscape and sales which were
below expectations. Sales of private and exclusive brands reached 50% of net sales in 2011, an increase of approximately 240
basis points over 2010.
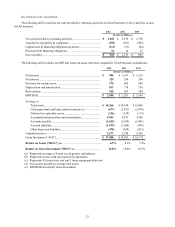
Selling, general and administrative expenses.
2012 2011 2010
(Dollars in Millions)
Selling, general, and administrative expenses..................................... $ 4,267 $ 4,243 $ 4,190
As a percent of net sales...................................................................... 22.1% 22.6% 22.8%
Selling, general and administrative expenses (“SG&A”) include compensation and benefit costs (including stores,
headquarters, buying and merchandising and distribution centers); occupancy and operating costs of our retail, distribution and
corporate facilities; freight expenses associated with moving merchandise from our distribution centers to our retail stores and
among distribution and retail facilities; advertising expenses, offset by vendor payments for reimbursement of specific,
incremental and identifiable costs; net revenues from our Kohl’s credit card operations; and other administrative revenues and
expenses. SG&A also includes the costs incurred prior to new store openings, such as advertising, hiring and training costs for
new employees, processing and transporting initial merchandise, and rent expense. We do not include depreciation and
amortization in SG&A. The classification of these expenses varies across the retail industry.
SG&A for 2012 increased $24 million, or 1% over 2011. The increase in SG&A is due primarily to higher distribution
costs, increased marketing, investments in technology and infrastructure related to our E-Commerce business and the extra
week in the 2012 retail calendar. These increases were partially offset by lower incentive costs. SG&A as a percent of sales
decreased, or "leveraged," by approximately 40 basis points in 2012.
Store payroll costs leveraged in 2012 due to continued implementation of electronic signs and strong payroll
management. Other store expenses including both rent-related expenses and variable costs, such as electricity and remodel
expenses, as a percent of net sales also declined.
Corporate operations reported significant leverage, primarily due to lower incentive costs.
Distribution costs totaled $245 million for 2012, $202 million for 2011, and $187 million for 2010 and did not leverage in
2012. The increase in 2012 is primarily due to growth in our E-Commerce business. Information technology costs also did not
leverage due to continued investments in our technology infrastructure.
Net revenues from our credit card operations were $388 million in 2012, $347 million in 2011, and $180 million in 2010.
The increase in 2012 compared to 2011 is due to higher average receivables which contributed to higher revenues during the
year. Offsetting these increases in were higher costs associated with a new credit card servicing platform.