Kohl's 2012 Annual Report Download - page 46
Download and view the complete annual report
Please find page 46 of the 2012 Kohl's annual report below. You can navigate through the pages in the report by either clicking on the pages listed below, or by using the keyword search tool below to find specific information within the annual report.-
 1
1 -
2
-
3
-
4
-
5
-
6
-
7
-
8
-
9
-
10
-
11
-
12
-
13
-
14
-
15
-
16
-
17
-
18
-
19
-
20
-
21
-
22
-
23
-
24
-
25
-
26
-
27
-
28
-
29
-
30
-
31
-
32
-
33
-
34
-
35
-
 36
36 -
 37
37 -
 38
38 -
 39
39 -
 40
40 -
 41
41 -
 42
42 -
 43
43 -
 44
44 -
 45
45 -
 46
46 -
 47
47 -
 48
48 -
 49
49 -
 50
50 -
 51
51 -
 52
52 -
 53
53 -
 54
54 -
 55
55 -
 56
56 -
57
-
58
-
59
-
60
-
61
-
62
-
63
-
64
-
65
-
66
-
67
-
68
-
69
-
70
-
71
-
72
-
73
-
74
-
75
-
76
-
77
-
78
-
79
-
80
-
81
-
82
-
83
-
84
-
85
-
86
-
87
-
88
-
89
-
90
-
91
-
92
-
93
-
94
-
95
-
96
-
97
-
98
-
99
-
100
-
101
-
102
-
103
-
104
-
105
-
106
-
107
-
108
-
109
-
110
-
111
-
112
-
113
-
114
-
115
-
116
-
117
-
118
-
119
-
120
-
121
-
122
-
123
-
124
-
125
-
126
-
127
-
128
-
129
-
130
-
131
-
132
-
133
-
134
-
135
-
136
-
137
-
138
-
139
-
140
-
141
-
142
-
143
-
144
-
145
-
146
-
147
-
148
-
149
-
150
-
151
-
152
-
153
-
154
-
155
-
156
-
157
-
158
-
159
-
160
-
161
-
162
-
163
-
164
 |
 |

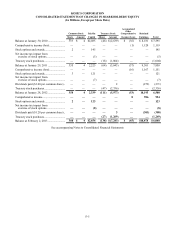
KOHL’S CORPORATION
NOTES TO CONSOLIDATED FINANCIAL STATEMENTS
F-7
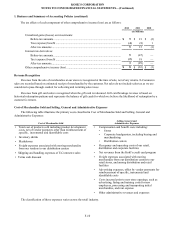
1. Business and Summary of Accounting Policies
Business
As of February 2, 2013, Kohl’s Corporation operated 1,146 family-oriented department stores and a website
(www.Kohls.com) that feature exclusive and national brand apparel, footwear, accessories, soft home products and housewares
targeted to middle-income customers. Our stores are located in 49 states.
Our authorized capital stock consists of 800 million shares of $0.01 par value common stock and 10 million shares of
$0.01 par value preferred stock.
Consolidation
The consolidated financial statements include the accounts of Kohl’s Corporation and its subsidiaries including Kohl’s
Department Stores, Inc., its primary operating company. All intercompany accounts and transactions have been eliminated.
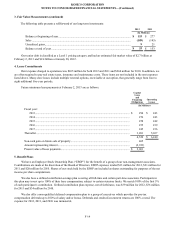
Accounting Period
Our fiscal year ends on the Saturday closest to January 31st each year. Unless otherwise stated, references to years in this
report relate to fiscal years rather than to calendar years. The following fiscal periods are presented in this report.
Fiscal year Ended Number of
Weeks
2012............................................................................................................ February 2, 2013 53
2011............................................................................................................ January 28, 2012 52
2010............................................................................................................ January 29, 2011 52
Use of Estimates
The preparation of consolidated financial statements in conformity with accounting principles generally accepted in the
United States requires management to make estimates and assumptions that affect the amounts reported in the consolidated
financial statements and accompanying notes. Actual results could differ from those estimates.
Cash and Cash Equivalents
In addition to money market investments, cash equivalents include commercial paper and certificates of deposit with
original maturities of three months or less. We carry these investments at cost which approximates fair value.
Also included in cash and cash equivalents are amounts due from credit card transactions with settlement terms of less
than five days. Credit and debit card receivables included within cash were $84 million at February 2, 2013 and $72 million at
January 28, 2012.
Long-term Investments
Long-term investments consist primarily of investments in auction rate securities (“ARS”) which are classified as
available-for-sale securities and recorded at fair value.
Merchandise Inventories
Merchandise inventories are valued at the lower of cost or market with cost determined on the first-in, first-out (“FIFO”)
basis using the retail inventory method (“RIM”). Under RIM, the valuation of inventory at cost and the resulting gross margins
are calculated by applying a cost-to-retail ratio to the retail value inventory. RIM is an averaging method that has been widely
used in the retail industry due to its practicality. The use of RIM will result in inventory being valued at the lower of cost or
market since permanent markdowns are currently taken as a reduction of the retail value of inventory. We record an additional
reserve when the future estimated selling price is less than cost.