Kohl's 2012 Annual Report Download - page 23
Download and view the complete annual report
Please find page 23 of the 2012 Kohl's annual report below. You can navigate through the pages in the report by either clicking on the pages listed below, or by using the keyword search tool below to find specific information within the annual report.-
 1
1 -
2
-
3
-
4
-
5
-
6
-
7
-
8
-
9
-
10
-
11
-
12
-
 13
13 -
 14
14 -
 15
15 -
 16
16 -
 17
17 -
 18
18 -
 19
19 -
 20
20 -
 21
21 -
 22
22 -
 23
23 -
 24
24 -
 25
25 -
 26
26 -
 27
27 -
 28
28 -
 29
29 -
 30
30 -
 31
31 -
 32
32 -
 33
33 -
34
-
35
-
36
-
37
-
38
-
39
-
40
-
41
-
42
-
43
-
44
-
45
-
46
-
47
-
48
-
49
-
50
-
51
-
52
-
53
-
54
-
55
-
56
-
57
-
58
-
59
-
60
-
61
-
62
-
63
-
64
-
65
-
66
-
67
-
68
-
69
-
70
-
71
-
72
-
73
-
74
-
75
-
76
-
77
-
78
-
79
-
80
-
81
-
82
-
83
-
84
-
85
-
86
-
87
-
88
-
89
-
90
-
91
-
92
-
93
-
94
-
95
-
96
-
97
-
98
-
99
-
100
-
101
-
102
-
103
-
104
-
105
-
106
-
107
-
108
-
109
-
110
-
111
-
112
-
113
-
114
-
115
-
116
-
117
-
118
-
119
-
120
-
121
-
122
-
123
-
124
-
125
-
126
-
127
-
128
-
129
-
130
-
131
-
132
-
133
-
134
-
135
-
136
-
137
-
138
-
139
-
140
-
141
-
142
-
143
-
144
-
145
-
146
-
147
-
148
-
149
-
150
-
151
-
152
-
153
-
154
-
155
-
156
-
157
-
158
-
159
-
160
-
161
-
162
-
163
-
164
 |
 |

23
We repurchased 26 million shares of our common stock for approximately $1.3 billion in 2012 and 46 million shares for
approximately $2.3 billion in 2011. The shares were purchased as part of our share repurchase program. In November 2012,
our Board of Directors increased the share repurchase authorization under our existing share repurchase program by $3.2
billion, to $3.5 billion. We expect to repurchase shares in open market transactions, subject to market conditions, over the next
three years.
We repaid long-term debt of $300 million in March 2011 and $100 million in October 2011. In October 2011, we issued
$650 million of 4.00% notes with semi-annual interest payments beginning in May 2012. In September 2012, we issued $350
million of 3.25% notes with semi-annual interest payments beginning in February 2013.
We have various facilities upon which we may draw funds, including a 5-year, $1 billion senior unsecured revolving
credit facility which we entered into in June 2011. The credit facility includes 16 lenders which have each committed between
$30 and $110 million each. The $1 billion facility replaced a $900 million facility which was scheduled to expire in October
2011. We also have a demand note with availability of $30 million. There were no draws on these facilities during 2012 or
2011.
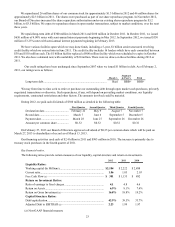
Our credit ratings have been unchanged since September 2007 when we issued $1 billion in debt. As of February 2,
2013, our ratings were as follows:
Moody’s Standard
& Poor’s Fitch
Long-term debt........................................................................................ Baa1 BBB+ BBB+
We may from time to time seek to retire or purchase our outstanding debt through open market cash purchases, privately
negotiated transactions or otherwise. Such repurchases, if any, will depend on prevailing market conditions, our liquidity
requirements, contractual restrictions and other factors. The amounts involved could be material.
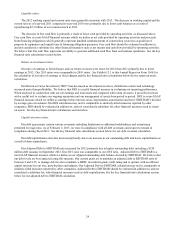
During 2012, we paid cash dividends of $300 million as detailed in the following table:
First Quarter Second Quarter Third Quarter Fourth Quarter
Declaration date.................................. February 22 May 9 August 7 November 7
Record date......................................... March 7 June 6 September 5 December 5
Payment date ...................................... March 28 June 27 September 26 December 26
Amount per common share ................ $0.32 $0.32 $0.32 $0.32
On February 27, 2013 our Board of Directors approved a dividend of $0.35 per common share which will be paid on
March 27, 2013 to shareholders of record as of March 13, 2013.
Our financing activities used cash of $2.4 billion in 2011 and $983 million in 2010. The increase is primarily due to
treasury stock purchases in the fourth quarter of 2011.
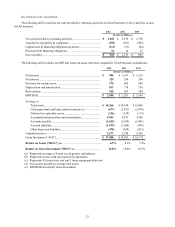
Key financial ratios.
The following ratios provide certain measures of our liquidity, capital structure and return on investments.
2012 2011 2010
Liquidity Ratios:
Working capital (In Millions).............................................................. $2,184 $ 2,222 $ 2,888
Current ratio......................................................................................... 1.86 1.85 2.03
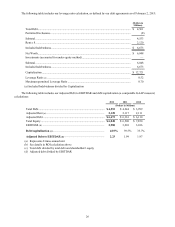
Free Cash Flow (a)................................................................................................... $ 381 $ 1,135 $ 892
Return on Investment Ratios:
Ratio of earnings to fixed charges....................................................... 4.1 4.8 4.6
Return on Assets.................................................................................. 6.9% 8.1% 7.4%
Return on Gross Investment (a)........................................................................... 16.8% 18.8% 19.2%
Capital Structure Ratios:
Debt/capitalization............................................................................... 42.9% 39.5% 33.7%
Adjusted Debt to EBITDAR (a).......................................................................... 2.23 1.99 1.97
(a) Non-GAAP financial measure