Kohl's 2012 Annual Report Download - page 48
Download and view the complete annual report
Please find page 48 of the 2012 Kohl's annual report below. You can navigate through the pages in the report by either clicking on the pages listed below, or by using the keyword search tool below to find specific information within the annual report.-
 1
1 -
2
-
3
-
4
-
5
-
6
-
7
-
8
-
9
-
10
-
11
-
12
-
13
-
14
-
15
-
16
-
17
-
18
-
19
-
20
-
21
-
22
-
23
-
24
-
25
-
26
-
27
-
28
-
29
-
30
-
31
-
32
-
33
-
34
-
35
-
36
-
37
-
 38
38 -
 39
39 -
 40
40 -
 41
41 -
 42
42 -
 43
43 -
 44
44 -
 45
45 -
 46
46 -
 47
47 -
 48
48 -
 49
49 -
 50
50 -
 51
51 -
 52
52 -
 53
53 -
 54
54 -
 55
55 -
 56
56 -
 57
57 -
 58
58 -
59
-
60
-
61
-
62
-
63
-
64
-
65
-
66
-
67
-
68
-
69
-
70
-
71
-
72
-
73
-
74
-
75
-
76
-
77
-
78
-
79
-
80
-
81
-
82
-
83
-
84
-
85
-
86
-
87
-
88
-
89
-
90
-
91
-
92
-
93
-
94
-
95
-
96
-
97
-
98
-
99
-
100
-
101
-
102
-
103
-
104
-
105
-
106
-
107
-
108
-
109
-
110
-
111
-
112
-
113
-
114
-
115
-
116
-
117
-
118
-
119
-
120
-
121
-
122
-
123
-
124
-
125
-
126
-
127
-
128
-
129
-
130
-
131
-
132
-
133
-
134
-
135
-
136
-
137
-
138
-
139
-
140
-
141
-
142
-
143
-
144
-
145
-
146
-
147
-
148
-
149
-
150
-
151
-
152
-
153
-
154
-
155
-
156
-
157
-
158
-
159
-
160
-
161
-
162
-
163
-
164
 |
 |

KOHL’S CORPORATION
NOTES TO CONSOLIDATED FINANCIAL STATEMENTS—(Continued)
F-9
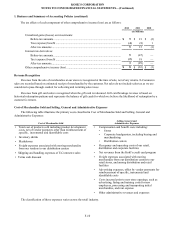
1. Business and Summary of Accounting Policies (continued)
We have corrected the presentation of $17 million of deferred revenues that were previously recorded as a reduction to
merchandise inventory as of January 28, 2012.
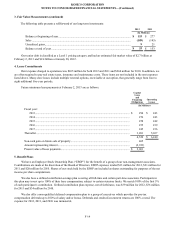
Self-Insurance
We use a combination of insurance and self-insurance for a number of risks including workers’ compensation, general
liability, and employee-related health care benefits, a portion of which is paid by our associates. Liabilities associated with these
losses include estimates of both reported losses and losses incurred but not yet reported. We use a third-party actuary, which
considers historical claims experience, demographic factors, severity factors and other actuarial assumptions, to estimate the
liabilities associated with these risks. The lifetime medical payment limit of $1.5 million per plan participant was eliminated on
December 31, 2010. Total estimated liabilities for workers’ compensation, general liability and employee-related health
benefits, excluding administrative expenses and before pre-funding, were approximately $100 million at February 2, 2013 and
$94 million at January 28, 2012. Although these amounts are actuarially determined based on analysis of historical trends, the
amounts that we will ultimately disburse could differ from these estimates.
For our property portfolio, we are self-insured for the first $250,000 of the claim plus 15% of additional losses up to $30
million. Effective January 1, 2013, the deductible was reduced to 10% of additional losses up to $30 million.
Long-term Liabilities
Other long-term liabilities consist of the following:
Feb 2,
2013 Jan 28,
2012
(In Millions)
Property-related liabilities (straight-line rents and rent incentives) ................................ $ 302 $ 285
Unrecognized tax benefits, including accrued interest and penalties.............................. 126 118
Other................................................................................................................................ 84 57
$ 512 $ 460
Treasury Stock
We account for repurchases of common stock using the cost method with common stock in treasury classified in the
Consolidated Balance Sheets as a reduction of shareholders’ equity.
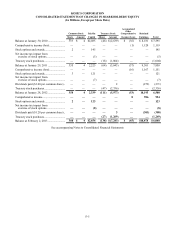
Accumulated Other Comprehensive Loss and Other Comprehensive Income (Loss)
Accumulated other comprehensive loss consists of the following:
Unrealized
Gains
(Losses) on
Investments
Loss on
Interest
Rate
Derivatives
Accumulated
Other
Comprehensive
Loss
(In Millions)
Balance at January 29, 2011.................................................... $ (37) — $ (37)
Other comprehensive income (loss)........................................ 13 (29)(16)
Balance at January 28, 2012 ................................................... (24)(29)(53)
Other comprehensive income.................................................. 5 3 8
Balance at February 2, 2013 ................................................... $ (19) $ (26) $ (45)