Kohl's 2012 Annual Report Download - page 22
Download and view the complete annual report
Please find page 22 of the 2012 Kohl's annual report below. You can navigate through the pages in the report by either clicking on the pages listed below, or by using the keyword search tool below to find specific information within the annual report.-
 1
1 -
2
-
3
-
4
-
5
-
6
-
7
-
8
-
9
-
10
-
11
-
 12
12 -
 13
13 -
 14
14 -
 15
15 -
 16
16 -
 17
17 -
 18
18 -
 19
19 -
 20
20 -
 21
21 -
 22
22 -
 23
23 -
 24
24 -
 25
25 -
 26
26 -
 27
27 -
 28
28 -
 29
29 -
 30
30 -
 31
31 -
 32
32 -
33
-
34
-
35
-
36
-
37
-
38
-
39
-
40
-
41
-
42
-
43
-
44
-
45
-
46
-
47
-
48
-
49
-
50
-
51
-
52
-
53
-
54
-
55
-
56
-
57
-
58
-
59
-
60
-
61
-
62
-
63
-
64
-
65
-
66
-
67
-
68
-
69
-
70
-
71
-
72
-
73
-
74
-
75
-
76
-
77
-
78
-
79
-
80
-
81
-
82
-
83
-
84
-
85
-
86
-
87
-
88
-
89
-
90
-
91
-
92
-
93
-
94
-
95
-
96
-
97
-
98
-
99
-
100
-
101
-
102
-
103
-
104
-
105
-
106
-
107
-
108
-
109
-
110
-
111
-
112
-
113
-
114
-
115
-
116
-
117
-
118
-
119
-
120
-
121
-
122
-
123
-
124
-
125
-
126
-
127
-
128
-
129
-
130
-
131
-
132
-
133
-
134
-
135
-
136
-
137
-
138
-
139
-
140
-
141
-
142
-
143
-
144
-
145
-
146
-
147
-
148
-
149
-
150
-
151
-
152
-
153
-
154
-
155
-
156
-
157
-
158
-
159
-
160
-
161
-
162
-
163
-
164
 |
 |

22
Operating activities.
Cash provided by operations decreased 41% in 2012 to $1.3 billion. The decrease is primarily the result of lower
earnings, a decrease in deferred taxes related to depreciation and higher inventory levels.
Total inventory per store increased 15% over January 28, 2012. Excluding E-Commerce, inventory per store increased
12% to $3.1 million per store as of February 2, 2013 compared to $2.8 million per store as of January 28, 2012. The higher
inventory levels were intended to support holiday sales in 2012, however, the merchandise did not sell as expected.
Accounts payable as a percent of inventory was 34.9% at February 2, 2013, compared to 38.3% at year-end 2011. The
decrease is primarily due to slower inventory turnover.
Cash provided by operations increased $389 million from $1.8 billion in 2010 to $2.1 billion in 2011. The increase was
primarily due to changes in accounts payable activities and deferred taxes related to depreciation. Accounts payable as a
percent of inventory was 38.3% at January 28, 2012, compared to 37.3% at year-end 2010. The change is primarily due to
expiration of vendor financing initiatives.
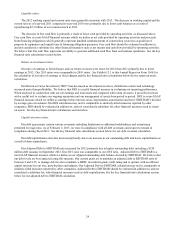
Investing activities.
Net cash used in investing activities decreased $142 million to $660 million in 2012, primarily due to lower capital
expenditures. Capital expenditures totaled $785 million for 2012, a $142 million decrease from 2011. This decrease is
primarily due to fewer remodels and new stores, partially offset by higher technology spending.
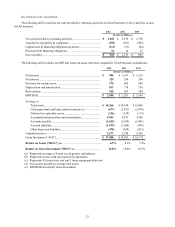
The following table summarizes expected and actual capital expenditures by major category:
2013
Estimate 2012 2011 2010
Computer hardware and software ................................................. 38% 33% 18% 17%
Fixtures and store improvements.................................................. 24 18 7 12
Remodels/relocations.................................................................... 19 14 26 30
New stores..................................................................................... 11 18 27 28
Distribution centers....................................................................... 2 14 15 10
Other.............................................................................................. 6 3 7 3
Total............................................................................................... 100% 100% 100% 100%
We expect total capital expenditures of approximately $700 million in fiscal 2013. The expected decrease from 2012 is
primarily due to a decrease in new store openings (approximately 12 expected in 2013 compared to 21 in 2012) and less
spending on E-Commerce building construction. These decreases will be partially offset by an expected increase in IT
spending. The actual amount of our future capital expenditures will depend primarily on the number and timing of new stores,
distribution centers and E-Commerce fulfillment centers opened and remodeled; the mix of owned, leased or acquired stores;
and IT spending. We do not anticipate that our expansion plans will be limited by any restrictive covenants in our financing
agreements.
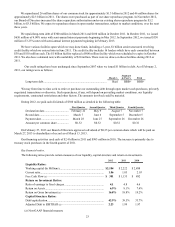
Sales of long-term investments generated cash of $109 million in 2012 and $145 million in 2011. As of February 2, 2013,
we had investments in auction rate securities (“ARS”) with a par value of $83 million and an estimated fair value of $52
million. Since 2008, the market for ARS has diminished. This has limited our ability to liquidate these investments, but we do
not believe that it will have a significant impact on our ability to fund ongoing operations and growth initiatives. To date, we
have collected all interest receivable on outstanding ARS when due and expect to continue to do so in the future. Substantially
all redemptions to date were made at par.
Net cash used in investing activities increased $45 million to $802 million in 2011, primarily due to an increase in capital
expenditures, partially offset by higher ARS sales. Capital expenditures totaled $927 million for 2011, a $126 million increase
over 2010. This increase is primarily due to higher capital spending for new stores, remodels, E-Commerce fulfillment centers,
and a call center in Texas.
Financing activities.
Our financing activities used cash of $1.3 billion in 2012 and $2.4 billion in 2011. The decrease is primarily due to lower
share repurchases.