Kohl's 2012 Annual Report Download - page 51
Download and view the complete annual report
Please find page 51 of the 2012 Kohl's annual report below. You can navigate through the pages in the report by either clicking on the pages listed below, or by using the keyword search tool below to find specific information within the annual report.-
 1
1 -
2
-
3
-
4
-
5
-
6
-
7
-
8
-
9
-
10
-
11
-
12
-
13
-
14
-
15
-
16
-
17
-
18
-
19
-
20
-
21
-
22
-
23
-
24
-
25
-
26
-
27
-
28
-
29
-
30
-
31
-
32
-
33
-
34
-
35
-
36
-
37
-
38
-
39
-
40
-
 41
41 -
 42
42 -
 43
43 -
 44
44 -
 45
45 -
 46
46 -
 47
47 -
 48
48 -
 49
49 -
 50
50 -
 51
51 -
 52
52 -
 53
53 -
 54
54 -
 55
55 -
 56
56 -
 57
57 -
 58
58 -
 59
59 -
 60
60 -
 61
61 -
62
-
63
-
64
-
65
-
66
-
67
-
68
-
69
-
70
-
71
-
72
-
73
-
74
-
75
-
76
-
77
-
78
-
79
-
80
-
81
-
82
-
83
-
84
-
85
-
86
-
87
-
88
-
89
-
90
-
91
-
92
-
93
-
94
-
95
-
96
-
97
-
98
-
99
-
100
-
101
-
102
-
103
-
104
-
105
-
106
-
107
-
108
-
109
-
110
-
111
-
112
-
113
-
114
-
115
-
116
-
117
-
118
-
119
-
120
-
121
-
122
-
123
-
124
-
125
-
126
-
127
-
128
-
129
-
130
-
131
-
132
-
133
-
134
-
135
-
136
-
137
-
138
-
139
-
140
-
141
-
142
-
143
-
144
-
145
-
146
-
147
-
148
-
149
-
150
-
151
-
152
-
153
-
154
-
155
-
156
-
157
-
158
-
159
-
160
-
161
-
162
-
163
-
164
 |
 |

KOHL’S CORPORATION
NOTES TO CONSOLIDATED FINANCIAL STATEMENTS—(Continued)
F-12
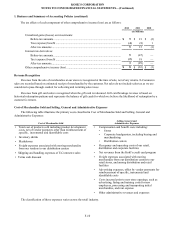
1. Business and Summary of Accounting Policies (continued)
Income Taxes
Income taxes are accounted for under the asset and liability method. Under this method, deferred tax assets and liabilities
are recorded based on differences between the amounts of assets and liabilities recognized for financial reporting purposes and
such amounts recognized for income tax purposes. Deferred tax assets and liabilities are calculated using the enacted tax rates
and laws that are expected to be in effect when the differences are expected to reverse. We establish valuation allowances for
deferred tax assets when we believe it is more likely than not that the asset will not be realizable for tax purposes.
We recognize interest and penalty expense related to unrecognized tax benefits in our provision for income tax expense.
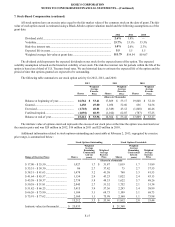
Net Income Per Share
Basic net income per share is net income divided by the average number of common shares outstanding during the period.
Diluted net income per share includes incremental shares assumed to be issued upon exercise of stock options.
The information required to compute basic and diluted net income per share is as follows:
2012 2011 2010
(In Millions, Except per Share Data)
Numerator—net income......................................................................................... $ 986 $ 1,167 $ 1,120
Denominator—weighted average shares
Basic ............................................................................................................... 235 270 304
Impact of dilutive employee stock options (a) ............................................... 21 2
Diluted ............................................................................................................ 237 271 306
Net income per share:
Basic ............................................................................................................... $ 4.19 $ 4.33 $ 3.69
Diluted ............................................................................................................ $ 4.17 $ 4.30 $ 3.66
(a) Excludes 14 million options for 2012, 11 million options for 2011 and 8 million options for 2010 as the
impact of such options was antidilutive.
Share-Based Awards
Stock-based compensation expense, including stock options and nonvested stock awards, is generally recognized on a
straight-line basis over the vesting period based on the fair value of awards which are expected to vest. The fair value of all
share-based awards is estimated on the date of grant.
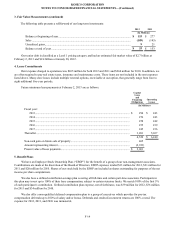
2. Debt
Long-term debt consists of the following non-callable and unsecured senior debt:
February 2, 2013 January 28, 2012
Maturing Effective
Rate Out-
standing Effective
Rate Out-
standing
(Dollars in Millions)
2017.......................................................................................... 6.31% $ 650 6.31% $ 650
2021.......................................................................................... 4.81% 650 4.81% 650
2023.......................................................................................... 3.25% 350 — —
2029.......................................................................................... 7.36% 200 7.36% 200
2033.......................................................................................... 6.05% 300 6.05% 300
2037.......................................................................................... 6.89% 350 6.89% 350
Total senior debt.............................................................................. 5.63% 2,500 6.01% 2,150
Unamortized debt discount.............................................................. (8)(9)
Long-term debt................................................................................ $ 2,492 $ 2,141
In September 2012, we issued $350 million of 3.25% notes with semi-annual interest payments beginning February 2013.
The notes mature on February 1, 2023.