Kohl's 2012 Annual Report Download - page 26
Download and view the complete annual report
Please find page 26 of the 2012 Kohl's annual report below. You can navigate through the pages in the report by either clicking on the pages listed below, or by using the keyword search tool below to find specific information within the annual report.-
 1
1 -
2
-
3
-
4
-
5
-
6
-
7
-
8
-
9
-
10
-
11
-
12
-
13
-
14
-
15
-
 16
16 -
 17
17 -
 18
18 -
 19
19 -
 20
20 -
 21
21 -
 22
22 -
 23
23 -
 24
24 -
 25
25 -
 26
26 -
 27
27 -
 28
28 -
 29
29 -
 30
30 -
 31
31 -
 32
32 -
 33
33 -
 34
34 -
 35
35 -
 36
36 -
37
-
38
-
39
-
40
-
41
-
42
-
43
-
44
-
45
-
46
-
47
-
48
-
49
-
50
-
51
-
52
-
53
-
54
-
55
-
56
-
57
-
58
-
59
-
60
-
61
-
62
-
63
-
64
-
65
-
66
-
67
-
68
-
69
-
70
-
71
-
72
-
73
-
74
-
75
-
76
-
77
-
78
-
79
-
80
-
81
-
82
-
83
-
84
-
85
-
86
-
87
-
88
-
89
-
90
-
91
-
92
-
93
-
94
-
95
-
96
-
97
-
98
-
99
-
100
-
101
-
102
-
103
-
104
-
105
-
106
-
107
-
108
-
109
-
110
-
111
-
112
-
113
-
114
-
115
-
116
-
117
-
118
-
119
-
120
-
121
-
122
-
123
-
124
-
125
-
126
-
127
-
128
-
129
-
130
-
131
-
132
-
133
-
134
-
135
-
136
-
137
-
138
-
139
-
140
-
141
-
142
-
143
-
144
-
145
-
146
-
147
-
148
-
149
-
150
-
151
-
152
-
153
-
154
-
155
-
156
-
157
-
158
-
159
-
160
-
161
-
162
-
163
-
164
 |
 |

26
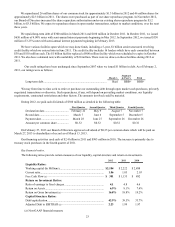
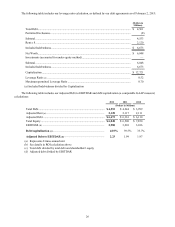
The following table includes our leverage ratio calculation, as defined by our debt agreements as of February 2, 2013:
(Dollars in
Millions)
Total Debt.................................................................................................................................. $ 4,561
Permitted Exclusions................................................................................................................. (8)
Subtotal ..................................................................................................................................... 4,553
Rent x 8..................................................................................................................................... 2,120
Included Indebtedness............................................................................................................... $ 6,673
Net Worth.................................................................................................................................. $ 6,048
Investments (accounted for under equity method).................................................................... —
Subtotal ..................................................................................................................................... 6,048
Included Indebtedness............................................................................................................... 6,673
Capitalization ............................................................................................................................ $ 12,721
Leverage Ratio (a)................................................................................................................................................... 0.52
Maximum permitted Leverage Ratio........................................................................................ 0.70
(a) Included Indebtedness divided by Capitalization
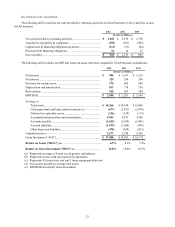
The following table includes our Adjusted Debt to EBITDAR and debt/capitalization (a comparable GAAP measure)
calculations:
2012 2011 2010
(Dollars in Millions)
Total Debt............................................................................................. $ 4,553 $ 4,244 $ 3,999
Adjusted Rent (a)....................................................................................................... 2,120 2,117 2,111
Adjusted Debt ...................................................................................... $ 6,673 $ 6,361 $ 6,110
Total Equity.......................................................................................... $ 6,048 $ 6,508 $ 7,850
EBITDAR (b) ............................................................................................................. 2,988 3,201 3,106
Debt/capitalization (c)........................................................................................... 42.9% 39.5% 33.7%
Adjusted Debt to EBITDAR (d)....................................................................... 2.23 1.99 1.97
(a) Represents 8 times annual rent
(b) See details in ROI calculation above
(c) Total debt divided by total debt and shareholders' equity
(d) Adjusted debt divided by EBITDAR