Kohl's 2012 Annual Report Download - page 19
Download and view the complete annual report
Please find page 19 of the 2012 Kohl's annual report below. You can navigate through the pages in the report by either clicking on the pages listed below, or by using the keyword search tool below to find specific information within the annual report.-
 1
1 -
2
-
3
-
4
-
5
-
6
-
7
-
8
-
 9
9 -
 10
10 -
 11
11 -
 12
12 -
 13
13 -
 14
14 -
 15
15 -
 16
16 -
 17
17 -
 18
18 -
 19
19 -
 20
20 -
 21
21 -
 22
22 -
 23
23 -
 24
24 -
 25
25 -
 26
26 -
 27
27 -
 28
28 -
 29
29 -
30
-
31
-
32
-
33
-
34
-
35
-
36
-
37
-
38
-
39
-
40
-
41
-
42
-
43
-
44
-
45
-
46
-
47
-
48
-
49
-
50
-
51
-
52
-
53
-
54
-
55
-
56
-
57
-
58
-
59
-
60
-
61
-
62
-
63
-
64
-
65
-
66
-
67
-
68
-
69
-
70
-
71
-
72
-
73
-
74
-
75
-
76
-
77
-
78
-
79
-
80
-
81
-
82
-
83
-
84
-
85
-
86
-
87
-
88
-
89
-
90
-
91
-
92
-
93
-
94
-
95
-
96
-
97
-
98
-
99
-
100
-
101
-
102
-
103
-
104
-
105
-
106
-
107
-
108
-
109
-
110
-
111
-
112
-
113
-
114
-
115
-
116
-
117
-
118
-
119
-
120
-
121
-
122
-
123
-
124
-
125
-
126
-
127
-
128
-
129
-
130
-
131
-
132
-
133
-
134
-
135
-
136
-
137
-
138
-
139
-
140
-
141
-
142
-
143
-
144
-
145
-
146
-
147
-
148
-
149
-
150
-
151
-
152
-
153
-
154
-
155
-
156
-
157
-
158
-
159
-
160
-
161
-
162
-
163
-
164
 |
 |

19
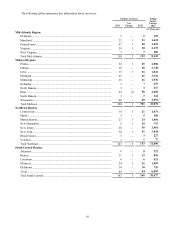
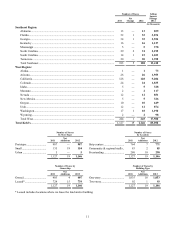
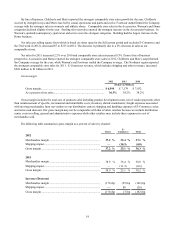
By line of business, Children's and Men's reported the strongest comparable store sales growth for the year. Children's
was led by strength in toys and Men's was led by casual sportswear and pants and active. Footwear outperformed the Company
average with the strongest sales in women's and athletic shoes. Comparable store sales in the Accessories, Women's and Home
categories declined slightly for the year. Sterling silver jewelry reported the strongest increase in the Accessories business. In
Women's, updated/contemporary sportswear and active were the strongest categories. Bedding had the largest increase in the
Home business.
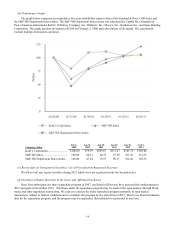
Net sales per selling square foot (which is based on stores open for the full current period and excludes E-Commerce and
the 53rd week in 2012), decreased $7 to $213 in 2012. The decrease is primarily due to a 2% decrease in sales at our
comparable stores.
Net sales for 2011 increased 2.2% over 2010 and comparable store sales increased 0.5%. From a line of business
perspective, Accessories and Home reported the strongest comparable store sales in 2011. Children's and Men’s outperformed
the Company average for the year, while Women's and Footwear trailed the Company average. The Northeast region reported
the strongest comparable store sales for 2011. E-Commerce revenue, which includes shipping and other revenues, increased
$269 million to $1 billion in 2011.
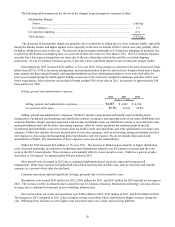
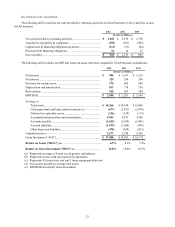
Gross margin.
2012 2011 2010
(Dollars in Millions)
Gross margin........................................................................................ $ 6,990 $ 7,179 $ 7,032
As a percent of net sales...................................................................... 36.3% 38.2% 38.2%
Gross margin includes the total cost of products sold, including product development costs, net of vendor payments other
than reimbursement of specific, incremental and identifiable costs; inventory shrink; markdowns; freight expenses associated
with moving merchandise from our vendors to our distribution centers; shipping and handling expenses of E-Commerce sales;
and terms cash discount. Our gross margin may not be comparable with that of other retailers because we include distribution
center costs in selling, general and administrative expenses while other retailers may include these expenses in cost of
merchandise sold.
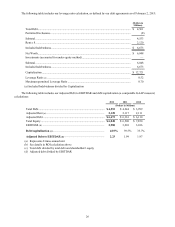
The following table summarizes gross margin as a percent of sales by channel:
Stores E-
Commerce Total
2012
Merchandise margin....................................................................... 37.2 % 35.4 % 37.1 %
Shipping impact.............................................................................. —(10.3)(0.8)
Gross margin .................................................................................. 37.2 % 25.1 % 36.3 %
2011
Merchandise margin....................................................................... 38.9 % 36.4 % 38.8 %
Shipping impact.............................................................................. —(11.3)(0.6)
Gross margin .................................................................................. 38.9 % 25.1 % 38.2 %
Increase (Decrease)
Merchandise margin....................................................................... (176) bp (95) bp (166) bp
Shipping impact.............................................................................. —88 (26)
Gross margin .................................................................................. (176) bp (7) bp (192) bp