Kohl's 2012 Annual Report Download - page 17
Download and view the complete annual report
Please find page 17 of the 2012 Kohl's annual report below. You can navigate through the pages in the report by either clicking on the pages listed below, or by using the keyword search tool below to find specific information within the annual report.-
 1
1 -
2
-
3
-
4
-
5
-
6
-
 7
7 -
 8
8 -
 9
9 -
 10
10 -
 11
11 -
 12
12 -
 13
13 -
 14
14 -
 15
15 -
 16
16 -
 17
17 -
 18
18 -
 19
19 -
 20
20 -
 21
21 -
 22
22 -
 23
23 -
 24
24 -
 25
25 -
 26
26 -
 27
27 -
28
-
29
-
30
-
31
-
32
-
33
-
34
-
35
-
36
-
37
-
38
-
39
-
40
-
41
-
42
-
43
-
44
-
45
-
46
-
47
-
48
-
49
-
50
-
51
-
52
-
53
-
54
-
55
-
56
-
57
-
58
-
59
-
60
-
61
-
62
-
63
-
64
-
65
-
66
-
67
-
68
-
69
-
70
-
71
-
72
-
73
-
74
-
75
-
76
-
77
-
78
-
79
-
80
-
81
-
82
-
83
-
84
-
85
-
86
-
87
-
88
-
89
-
90
-
91
-
92
-
93
-
94
-
95
-
96
-
97
-
98
-
99
-
100
-
101
-
102
-
103
-
104
-
105
-
106
-
107
-
108
-
109
-
110
-
111
-
112
-
113
-
114
-
115
-
116
-
117
-
118
-
119
-
120
-
121
-
122
-
123
-
124
-
125
-
126
-
127
-
128
-
129
-
130
-
131
-
132
-
133
-
134
-
135
-
136
-
137
-
138
-
139
-
140
-
141
-
142
-
143
-
144
-
145
-
146
-
147
-
148
-
149
-
150
-
151
-
152
-
153
-
154
-
155
-
156
-
157
-
158
-
159
-
160
-
161
-
162
-
163
-
164
 |
 |
17
Item 7. Management’s Discussion and Analysis of Financial Condition and Results of Operations
Executive Summary
Total net sales for 2012 were $19.3 billion, a 2.5% increase over 2011. Comparable store sales increased 0.3% over 2011.
E-Commerce revenues increased over 40% to $1.4 billion. Comparable sales were driven by higher average unit prices which
were substantially offset by fewer transactions.
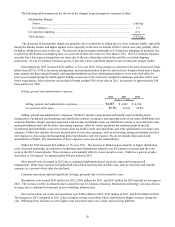
Gross margin declined approximately 190 basis points to 36.3% of sales for 2012. The decrease reflects lower prices as
we focused on improving value to our customer during the year and due to late and lower than expected Holiday sales which
resulted in deeper price cuts.
Expenses were well-managed during the year. Our stores organization continues to drive payroll efficiencies. We also
reported significant leverage in our corporate operations, primarily due to lower incentive costs.
For 2012, net income was $986 million, or $4.17 per diluted share, compared to $1.2 billion, or $4.30 per diluted share
for 2011.
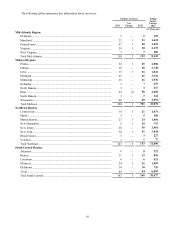
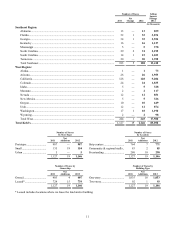
We operated 1,146 stores as of year-end. In 2012, we opened 21 new stores, including one relocated store, closed one
store and remodeled 50 stores.
2013 Outlook
Our current expectations for fiscal 2013 compared to 2012 are as follows:
Total sales................................................................................................................... Increase 0 - 2%
Comparable store sales ............................................................................................... Increase 0 - 2%
Gross margin as a percent of sales.............................................................................. Increase 15 - 30 bp
SG&A ......................................................................................................................... Increase 1.5 - 3%
Earnings per diluted share .......................................................................................... $4.15 - $4.45
Our guidance assumes share repurchases of $1 billion at an average price of $50 per share.
We expect to open approximately 12 new stores in 2013 - nine in the Spring and three in the Fall. Eleven of the new
stores will be “small” stores with less than 64,000 square feet of retail space. We are temporarily reducing the number of
remodels to approximately 30 stores in 2013 as we continue to evaluate and test different categories and space allocations in
our stores.
Results of Operations
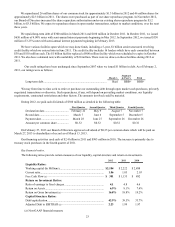
53rd Week.
The retail calendar for fiscal January 2013 included a fifth week, resulting in a 53-week year. During this 53rd week, total
sales were $169 million; selling, general and administrative expenses were approximately $30 million; interest was
approximately $2 million; net income was approximately $15 million and diluted earnings per share was approximately $0.06.
Our comparable store sales in 2012 exclude the impact of the 53rd week and compare the 52 weeks ended January 26, 2013 to
the 52 weeks ended January 28, 2012.