Kohl's 2012 Annual Report Download - page 25
Download and view the complete annual report
Please find page 25 of the 2012 Kohl's annual report below. You can navigate through the pages in the report by either clicking on the pages listed below, or by using the keyword search tool below to find specific information within the annual report.-
 1
1 -
2
-
3
-
4
-
5
-
6
-
7
-
8
-
9
-
10
-
11
-
12
-
13
-
14
-
 15
15 -
 16
16 -
 17
17 -
 18
18 -
 19
19 -
 20
20 -
 21
21 -
 22
22 -
 23
23 -
 24
24 -
 25
25 -
 26
26 -
 27
27 -
 28
28 -
 29
29 -
 30
30 -
 31
31 -
 32
32 -
 33
33 -
 34
34 -
 35
35 -
36
-
37
-
38
-
39
-
40
-
41
-
42
-
43
-
44
-
45
-
46
-
47
-
48
-
49
-
50
-
51
-
52
-
53
-
54
-
55
-
56
-
57
-
58
-
59
-
60
-
61
-
62
-
63
-
64
-
65
-
66
-
67
-
68
-
69
-
70
-
71
-
72
-
73
-
74
-
75
-
76
-
77
-
78
-
79
-
80
-
81
-
82
-
83
-
84
-
85
-
86
-
87
-
88
-
89
-
90
-
91
-
92
-
93
-
94
-
95
-
96
-
97
-
98
-
99
-
100
-
101
-
102
-
103
-
104
-
105
-
106
-
107
-
108
-
109
-
110
-
111
-
112
-
113
-
114
-
115
-
116
-
117
-
118
-
119
-
120
-
121
-
122
-
123
-
124
-
125
-
126
-
127
-
128
-
129
-
130
-
131
-
132
-
133
-
134
-
135
-
136
-
137
-
138
-
139
-
140
-
141
-
142
-
143
-
144
-
145
-
146
-
147
-
148
-
149
-
150
-
151
-
152
-
153
-
154
-
155
-
156
-
157
-
158
-
159
-
160
-
161
-
162
-
163
-
164
 |
 |

25
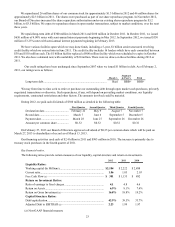
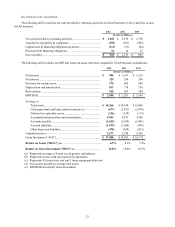
Key financial ratio calculations.
The following table reconciles net cash provided by operating activities (a GAAP measure) to free cash flow (a non-
GAAP measure).
2012 2011 2010
(Dollars in Millions)
Net cash provided by operating activities ....................................... $ 1,265 $ 2,139 $ 1,750
Acquisition of property & equipment.............................................. (785)(927)(801)
Capital lease & financing obligation payments............................... (111)(91)(84)
Proceeds from financing obligations............................................... 12 14 27
Free cash flow.................................................................................. $ 381 $ 1,135 $ 892
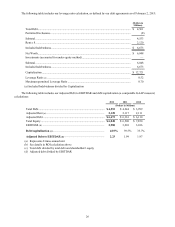
The following table includes our ROI and return on assets (the most comparable GAAP measure) calculations:
2012 2011 2010
(Dollars in Millions)
Net income...................................................................................... $ 986 $ 1,167 $ 1,120
Net interest...................................................................................... 329 299 304
Provision for income taxes.............................................................. 575 692 668
Depreciation and amortization........................................................ 833 778 750
Rent expense ................................................................................... 265 265 264
EBITDAR ....................................................................................... $ 2,988 $ 3,201 $ 3,106
Average: (a)
Total assets............................................................................... $ 14,266 $ 14,434 $ 15,090
Cash equivalents and long-term investments (b) ........................... (677) (1,421)(2,478)
Deferred tax and other assets................................................... (126) (124)(115)
Accumulated depreciation and amortization ........................... 4,943 4,473 3,980
Accounts payable..................................................................... (1,622) (1,439)(1,441)
Accrued liabilities.................................................................... (1,079) (1,068)(995)
Other long-term liabilities........................................................ (478) (458)(413)
Capitalized rent (c).............................................................................................. 2,573 2,598 2,546
Gross Investment (“AGI”) .............................................................. $ 17,800 $ 16,995 $ 16,174
Return on Assets (“ROA”) (d).................................................................... 6.9% 8.1% 7.4%
Return on Gross Investment (“ROI”) (e).............................................. 16.8% 18.8% 19.2%
(a) Represents average of 5 most recent quarter end balances
(b) Represents excess cash not required for operations
(c) Represents 10 times store rent and 5 times equipment/other rent
(d) Net income divided by average total assets
(e) EBITDAR divided by Gross Investment