McDonalds 2012 Annual Report Download - page 11
Download and view the complete annual report
Please find page 11 of the 2012 McDonalds annual report below. You can navigate through the pages in the report by either clicking on the pages listed below, or by using the keyword search tool below to find specific information within the annual report.-
 1
1 -
 2
2 -
 3
3 -
 4
4 -
 5
5 -
 6
6 -
 7
7 -
 8
8 -
 9
9 -
 10
10 -
 11
11 -
 12
12 -
 13
13 -
 14
14 -
 15
15 -
 16
16 -
 17
17 -
 18
18 -
 19
19 -
 20
20 -
 21
21 -
 22
22 -
23
-
24
-
25
-
26
-
27
-
28
-
29
-
30
-
31
-
32
-
33
-
34
-
35
-
36
-
37
-
38
-
39
-
40
-
41
-
42
-
43
-
44
-
45
-
46
-
47
-
48
-
49
-
50
-
51
-
52
-
53
-
54
 |
 |

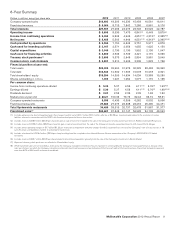
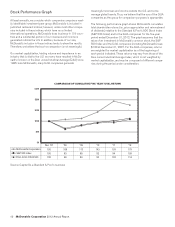
6-Year Summary
Dollars in millions, except per share data 2012 2011 2010 2009 2008 2007
Company-operated sales $18,603 18,293 16,233 15,459 16,561 16,611
Franchised revenues $ 8,964 8,713 7,842 7,286 6,961 6,176
Total revenues $27,567 27,006 24,075 22,745 23,522 22,787
Operating income $ 8,605 8,530 7,473 6,841(1) 6,443 3,879(4)
Income from continuing operations $ 5,465 5,503 4,946 4,551(1,2) 4,313(3) 2,335(4,5)
Net income $ 5,465 5,503 4,946 4,551(1,2) 4,313(3) 2,395(4,5,6)
Cash provided by operations $ 6,966 7,150 6,342 5,751 5,917 4,876
Cash used for investing activities $ 3,167 2,571 2,056 1,655 1,625 1,150
Capital expenditures $ 3,049 2,730 2,135 1,952 2,136 1,947
Cash used for financing activities $ 3,850 4,533 3,729 4,421 4,115 3,996
Treasury stock purchases(7) $ 2,605 3,373 2,648 2,854 3,981 3,949
Common stock cash dividends $ 2,897 2,610 2,408 2,235 1,823 1,766
Financial position at year end:
Total assets $35,386 32,990 31,975 30,225 28,462 29,392
Total debt $13,633 12,500 11,505 10,578 10,218 9,301
Total shareholders’ equity $15,294 14,390 14,634 14,034 13,383 15,280
Shares outstanding in millions 1,003 1,021 1,054 1,077 1,115 1,165
Per common share:
Income from continuing operations-diluted $ 5.36 5.27 4.58 4.11(1,2) 3.76(3) 1.93(4,5)
Earnings-diluted $ 5.36 5.27 4.58 4.11(1,2) 3.76(3) 1.98(4,5,6)
Dividends declared $ 2.87 2.53 2.26 2.05 1.63 1.50
Market price at year end $ 88.21 100.33 76.76 62.44 62.19 58.91
Company-operated restaurants 6,598 6,435 6,399 6,262 6,502 6,906
Franchised restaurants 27,882 27,075 26,338 26,216 25,465 24,471
Total Systemwide restaurants 34,480 33,510 32,737 32,478 31,967 31,377
Franchised sales(8) $69,687 67,648 61,147 56,928 54,132 46,943
(1) Includes pretax income due to Impairment and other charges (credits), net of $61.1 million ($91.4 million after tax or $0.08 per share) primarily related to the resolution of certain
liabilities retained in connection with the 2007 Latin America developmental license transaction.
(2) Includes income of $58.8 million ($0.05 per share) for gain on sale of investment related to the sale of the Company’s minority ownership interest in Redbox Automated Retail, LLC.
(3) Includes income of $109.0 million ($0.09 per share) for gain on sale of investment from the sale of the Company’s minority ownership interest in U.K.- based Pret A Manger.
(4) Includes pretax operating charges of $1.7 billion ($1.32 per share) due to Impairment and other charges (credits), net primarily as a result of the Company’s sale of its businesses in 18
Latin American and Caribbean markets to a developmental licensee.
(5) Includes a tax benefit of $316.4 million ($0.26 per share) resulting from the completion of an Internal Revenue Service examination of the Company’s 2003-2004 U.S. federal
tax returns.
(6) Includes income of $60.1 million ($0.05 per share) related to discontinued operations primarily from the sale of the Company’s investment in Boston Market.
(7) Represents treasury stock purchases as reflected in Shareholders’ equity.
(8) While franchised sales are not recorded as revenues by the Company, management believes they are important in understanding the Company’s financial performance because these
sales are the basis on which the Company calculates and records franchised revenues and are indicative of the financial health of the franchisee base. Franchised restaurants represent
more than 80% of McDonald’s restaurants worldwide.
McDonald’s Corporation 2012 Annual Report 9