McDonalds 2012 Annual Report Download - page 45
Download and view the complete annual report
Please find page 45 of the 2012 McDonalds annual report below. You can navigate through the pages in the report by either clicking on the pages listed below, or by using the keyword search tool below to find specific information within the annual report.-
 1
1 -
2
-
3
-
4
-
5
-
6
-
7
-
8
-
9
-
10
-
11
-
12
-
13
-
14
-
15
-
16
-
17
-
18
-
19
-
20
-
21
-
22
-
23
-
24
-
25
-
26
-
27
-
28
-
29
-
30
-
31
-
32
-
33
-
34
-
 35
35 -
 36
36 -
 37
37 -
 38
38 -
 39
39 -
 40
40 -
 41
41 -
 42
42 -
 43
43 -
 44
44 -
 45
45 -
 46
46 -
 47
47 -
 48
48 -
 49
49 -
 50
50 -
 51
51 -
 52
52 -
 53
53 -
 54
54
 |
 |

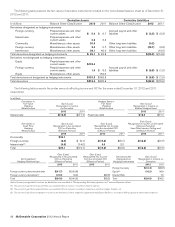
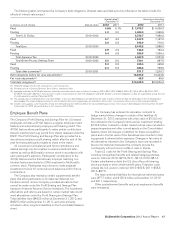
The following table summarizes the Company’s debt obligations. (Interest rates and debt amounts reflected in the table include the
effects of interest rate swaps.)
Interest rates(1)
December 31 Amounts outstanding
December 31
In millions of U.S. Dollars Maturity dates 2012 2011 2012 2011
Fixed 4.8% 5.1% $ 7,075.7 $ 6,039.3
Floating 1.2 2.0 1,650.0 1,399.9
Total U.S. Dollars 2013-2042 8,725.7 7,439.2
Fixed 3.7 4.5 1,847.2 1,167.0
Floating 2.9 2.8 348.0 719.0
Total Euro 2013-2024 2,195.2 1,886.0
Fixed 2.9 2.9 144.2 162.4
Floating 0.4 0.6 923.3 1,039.4
Total Japanese Yen 2013-2030 1,067.5 1,201.8
Total British Pounds Sterling-Fixed 2020-2032 6.0 6.0 730.1 697.8
Fixed 2.0 2.8 305.4 495.8
Floating 5.4 5.6 566.3 723.9
Total other currencies(2) 2013-2021 871.7 1,219.7
Debt obligations before fair value adjustments(3) 13,590.2 12,444.5
Fair value adjustments(4) 42.3 55.9
Total debt obligations(5) $13,632.5 $12,500.4
(1) Weighted-average effective rate, computed on a semi-annual basis.
(2) Primarily consists of Chinese Renminbi, Swiss Francs, and Korean Won.
(3) Aggregate maturities for 2012 debt balances, before fair value adjustments, were as follows (in millions): 2013–$0.0; 2014–$659.5; 2015–$1,167.6; 2016–$2,437.5; 2017–
$1,052.9; Thereafter–$8,272.7. These amounts include a reclassification of short-term obligations totaling $1.5 billion to long-term obligations as they are supported by a long-term line
of credit agreement expiring in November 2016.
(4) The carrying value of underlying items in fair value hedges, in this case debt obligations, are adjusted for fair value changes to the extent they are attributable to the risk designated as
being hedged. The related hedging instrument is also recorded at fair value in prepaid expenses and other current assets, miscellaneous other assets or other long-term liabilities.
(5) Includes notes payable, current maturities of long-term debt and long-term debt included on the Consolidated balance sheet. The increase in debt obligations from December 31, 2011
to December 31, 2012 was primarily due to net issuances of $1.2 billion.
Employee Benefit Plans
The Company’s Profit Sharing and Savings Plan for U.S.-based
employees includes a 401(k) feature, a regular employee match
feature, and a discretionary employer profit sharing match. The
401(k) feature allows participants to make pretax contributions
that are matched each pay period from shares released under the
ESOP. The Profit Sharing and Savings Plan also provides for a
discretionary employer profit sharing match after the end of the
year for those participants eligible to share in the match.
All current account balances and future contributions and
related earnings can be invested in several investment alter-
natives as well as McDonald’s common stock in accordance with
each participant’s elections. Participants’ contributions to the
401(k) feature and the discretionary employer matching con-
tribution feature are limited to 20% investment in McDonald’s
common stock. Participants may choose to make separate
investment choices for current account balances and for future
contributions.
The Company also maintains certain supplemental benefit
plans that allow participants to (i) make tax-deferred con-
tributions and (ii) receive Company-provided allocations that
cannot be made under the Profit Sharing and Savings Plan
because of Internal Revenue Service limitations. The investment
alternatives and returns are based on certain market-rate invest-
ment alternatives under the Profit Sharing and Savings Plan.
Total liabilities were $493.5 million at December 31, 2012, and
$482.5 million at December 31, 2011, and were primarily
included in other long-term liabilities on the Consolidated balance
sheet.
The Company has entered into derivative contracts to
hedge market-driven changes in certain of the liabilities. At
December 31, 2012, derivatives with a fair value of $132.3 mil-
lion indexed to the Company’s stock and an investment totaling
$123.8 million indexed to certain market indices were included in
prepaid expenses and other current assets on the Consolidated
balance sheet. All changes in liabilities for these nonqualified
plans and in the fair value of the derivatives are recorded in Sell-
ing, general & administrative expenses. Changes in fair value of
the derivatives indexed to the Company’s stock are recorded in
the income statement because the contracts provide the
counterparty with a choice to settle in cash or shares.
Total U.S. costs for the Profit Sharing and Savings Plan,
including nonqualified benefits and related hedging activities,
were (in millions): 2012–$27.9; 2011–$41.3; 2010–$51.4.
Certain subsidiaries outside the U.S. also offer profit sharing,
stock purchase or other similar benefit plans. Total plan costs
outside the U.S. were (in millions): 2012–$62.5; 2011–$58.3;
2010–$57.6.
The total combined liabilities for international retirement plans
were $77.7 million and $125.4 million at December 31, 2012
and 2011, respectively.
Other postretirement benefits and post-employment benefits
were immaterial.
McDonald’s Corporation 2012 Annual Report 43