McDonalds 2012 Annual Report Download - page 23
Download and view the complete annual report
Please find page 23 of the 2012 McDonalds annual report below. You can navigate through the pages in the report by either clicking on the pages listed below, or by using the keyword search tool below to find specific information within the annual report.-
 1
1 -
2
-
3
-
4
-
5
-
6
-
7
-
8
-
9
-
10
-
11
-
12
-
 13
13 -
 14
14 -
 15
15 -
 16
16 -
 17
17 -
 18
18 -
 19
19 -
 20
20 -
 21
21 -
 22
22 -
 23
23 -
 24
24 -
 25
25 -
 26
26 -
 27
27 -
 28
28 -
 29
29 -
 30
30 -
 31
31 -
 32
32 -
 33
33 -
34
-
35
-
36
-
37
-
38
-
39
-
40
-
41
-
42
-
43
-
44
-
45
-
46
-
47
-
48
-
49
-
50
-
51
-
52
-
53
-
54
 |
 |

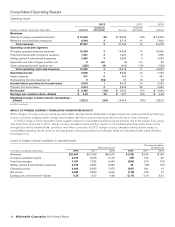
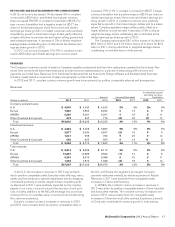
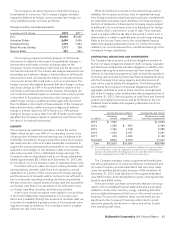
Selling, general and administrative expenses as a percent of
revenues were 8.9% in 2012 and 2011, and 9.7% in 2010. Sell-
ing, general and administrative expenses as a percent of
Systemwide sales were 2.8% in 2012 and 2011, and 3.0% in
2010. Management believes that analyzing selling, general and
administrative expenses as a percent of Systemwide sales, as
well as revenues, is meaningful because these costs are incurred
to support the overall McDonald’s business.
IMPAIRMENT AND OTHER CHARGES (CREDITS), NET
Impairment and other charges (credits), net
In millions 2012 2011 2010
Europe $7 $1
APMEA $(4) 49
Other Countries & Corporate 1(21)
Total $8 $(4) $ 29
In 2010, the Company recorded expense of $29 million pri-
marily related to its share of restaurant closing costs in
McDonald’s Japan in conjunction with the strategic review of the
market’s restaurant portfolio, partly offset by income related to
the resolution of certain liabilities retained in connection with the
2007 Latin America developmental license transaction.
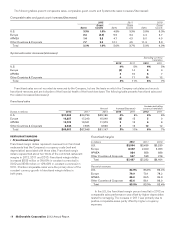
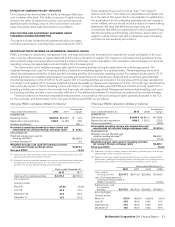
OTHER OPERATING (INCOME) EXPENSE, NET
Other operating (income) expense, net
In millions 2012 2011 2010
Gains on sales of restaurant
businesses $(152) $ (82) $ (79)
Equity in earnings of unconsolidated
affiliates (144) (178) (164)
Asset dispositions and other expense 44 27 45
Total $(252) $(233) $(198)
• Gains on sales of restaurant businesses
Gains on sales of restaurant businesses include gains from sales
of Company-operated restaurants. The Company’s purchases
and sales of businesses with its franchisees are aimed at achiev-
ing an optimal ownership mix in each market. Resulting gains or
losses are recorded in operating income because the trans-
actions are a recurring part of our business. Gains on sales of
restaurant businesses increased in 2012 due primarily to sales of
restaurants in China to developmental licensees, as well as sales
of restaurants in Europe and Canada.
• Equity in earnings of unconsolidated affiliates
Unconsolidated affiliates and partnerships are businesses in
which the Company actively participates, but does not control.
The Company records equity in earnings from these entities
representing McDonald’s share of results. For foreign affiliated
markets—primarily Japan—results are reported after interest
expense and income taxes. McDonald’s share of results for part-
nerships in certain consolidated markets such as the U.S. is
reported before income taxes. These partnership restaurants are
operated under conventional franchise arrangements and, there-
fore, are classified as conventional franchised restaurants. Equity
in earnings of unconsolidated affiliates decreased in 2012 due to
lower operating results, primarily in Japan. Results in 2011
reflected a benefit from stronger foreign currencies, partly offset
by the decline in the number of unconsolidated partnerships in
the U.S.
• Asset dispositions and other expense
Asset dispositions and other expense consists of gains or losses
on excess property and other asset dispositions, provisions for
restaurant closings and uncollectible receivables, asset write-offs
due to restaurant reinvestment, and other miscellaneous income
and expenses. Asset dispositions and other expense increased in
2012 primarily due to lower gains on unconsolidated partnership
dissolutions in the U.S. Results in 2011 reflected higher gains on
unconsolidated partnership dissolutions in the U.S.
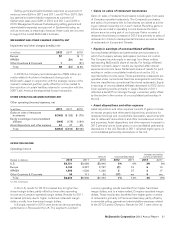
OPERATING INCOME
Operating income
Amount Increase/(decrease) Increase excluding
currency translation
Dollars in millions 2012 2011 2010 2012 2011 2012 2011
U.S. $3,751 $3,666 $3,446 2% 6% 2% 6%
Europe 3,196 3,227 2,797 (1) 15 610
APMEA 1,566 1,526 1,200 327 317
Other Countries & Corporate 92 111 30 (17) nm 9nm
Total $8,605 $8,530 $7,473 1% 14% 4% 10%
nm Not meaningful
In the U.S., results for 2012 increased due to higher fran-
chised margin dollars, partly offset by lower other operating
income and Company-operated margin dollars. Results for 2011
increased primarily due to higher combined restaurant margin
dollars, mostly from franchised margin dollars.
In Europe, results for 2012 were driven by strong operating
performance in Russia and the U.K. The segment’s constant
currency operating results benefited from higher franchised
margin dollars, and to a lesser extent, Company-operated margin
dollars. These results also benefited from higher gains on sales
of restaurants, primarily in France and Germany, partly offset by
incremental selling, general and administrative expenses related
to the 2012 London Olympics. Results for 2011 were driven by
McDonald’s Corporation 2012 Annual Report 21