McDonalds 2012 Annual Report Download - page 34
Download and view the complete annual report
Please find page 34 of the 2012 McDonalds annual report below. You can navigate through the pages in the report by either clicking on the pages listed below, or by using the keyword search tool below to find specific information within the annual report.-
 1
1 -
2
-
3
-
4
-
5
-
6
-
7
-
8
-
9
-
10
-
11
-
12
-
13
-
14
-
15
-
16
-
17
-
18
-
19
-
20
-
21
-
22
-
23
-
 24
24 -
 25
25 -
 26
26 -
 27
27 -
 28
28 -
 29
29 -
 30
30 -
 31
31 -
 32
32 -
 33
33 -
 34
34 -
 35
35 -
 36
36 -
 37
37 -
 38
38 -
 39
39 -
 40
40 -
 41
41 -
 42
42 -
 43
43 -
 44
44 -
45
-
46
-
47
-
48
-
49
-
50
-
51
-
52
-
53
-
54
 |
 |

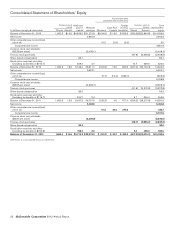
Consolidated Statement of Shareholders’ Equity
Common stock
issued
Accumulated other
comprehensive income (loss)
Common stock in
treasury
Additional
paid-in
capital Retained
earnings Pensions Cash flow
hedges
Foreign
currency
translation
Total
shareholders’
equityIn millions, except per share data Shares Amount Shares Amount
Balance at December 31, 2009 1,660.6 $16.6 $4,853.9 $31,270.8 $(134.6) $ 16.5 $ 865.5 (583.9) $(22,854.8) $14,033.9
Net income 4,946.3 4,946.3
Other comprehensive income (loss),
net of tax 10.0 (1.5) (3.0) 5.5
Comprehensive income 4,951.8
Common stock cash dividends
($2.26 per share) (2,408.1) (2,408.1)
Treasury stock purchases (37.8) (2,648.5) (2,648.5)
Share-based compensation 83.1 83.1
Stock option exercises and other
(including tax benefits of $146.1) 259.4 2.7 14.7 359.9 622.0
Balance at December 31, 2010 1,660.6 16.6 5,196.4 33,811.7 (124.6) 15.0 862.5 (607.0) (25,143.4) 14,634.2
Net income 5,503.1 5,503.1
Other comprehensive income (loss),
net of tax (7.7) (10.4) (285.1) (303.2)
Comprehensive income 5,199.9
Common stock cash dividends
($2.53 per share) (2,609.7) (2,609.7)
Treasury stock purchases (41.9) (3,372.9) (3,372.9)
Share-based compensation 86.2 86.2
Stock option exercises and other
(including tax benefits of $116.7) 204.7 2.4 9.7 245.4 452.5
Balance at December 31, 2011 1,660.6 16.6 5,487.3 36,707.5 (132.3) 4.6 577.4 (639.2) (28,270.9) 14,390.2
Net income 5,464.8 5,464.8
Other comprehensive income (loss),
net of tax 41.5 30.6 274.6 346.7
Comprehensive income 5,811.5
Common stock cash dividends
($2.87 per share) (2,896.6) (2,896.6)
Treasury stock purchases (28.1) (2,605.4) (2,605.4)
Share-based compensation 93.4 93.4
Stock option exercises and other
(including tax benefits of $150.8) 198.2 2.3 9.4 300.0 500.5
Balance at December 31, 2012 1,660.6 $16.6 $5,778.9 $39,278.0 $ (90.8) $ 35.2 $ 852.0 (657.9) $(30,576.3) $15,293.6
See Notes to consolidated financial statements.
32 McDonald’s Corporation 2012 Annual Report