McDonalds 2012 Annual Report Download - page 42
Download and view the complete annual report
Please find page 42 of the 2012 McDonalds annual report below. You can navigate through the pages in the report by either clicking on the pages listed below, or by using the keyword search tool below to find specific information within the annual report.-
 1
1 -
2
-
3
-
4
-
5
-
6
-
7
-
8
-
9
-
10
-
11
-
12
-
13
-
14
-
15
-
16
-
17
-
18
-
19
-
20
-
21
-
22
-
23
-
24
-
25
-
26
-
27
-
28
-
29
-
30
-
31
-
 32
32 -
 33
33 -
 34
34 -
 35
35 -
 36
36 -
 37
37 -
 38
38 -
 39
39 -
 40
40 -
 41
41 -
 42
42 -
 43
43 -
 44
44 -
 45
45 -
 46
46 -
 47
47 -
 48
48 -
 49
49 -
 50
50 -
 51
51 -
 52
52 -
53
-
54
 |
 |

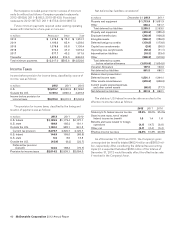
Rent expense included percent rents in excess of minimum
rents (in millions) as follows–Company-operated restaurants:
2012–$169.6; 2011–$165.2; 2010–$142.5. Franchised
restaurants: 2012–$178.7; 2011–$173.4; 2010–$167.3.
Future minimum payments required under existing operating
leases with initial terms of one year or more are:
In millions Restaurant Other Total
2013 $ 1,276.5 $ 75.2 $ 1,351.7
2014 1,193.6 65.4 1,259.0
2015 1,076.6 53.8 1,130.4
2016 972.4 47.0 1,019.4
2017 877.7 40.2 917.9
Thereafter 6,620.2 224.0 6,844.2
Total minimum payments $12,017.0 $505.6 $12,522.6
Income Taxes
Income before provision for income taxes, classified by source of
income, was as follows:
In millions 2012 2011 2010
U.S. $2,879.7 $3,202.8 $2,763.0
Outside the U.S. 5,199.3 4,809.4 4,237.3
Income before provision for
income taxes $8,079.0 $8,012.2 $7,000.3
The provision for income taxes, classified by the timing and
location of payment, was as follows:
In millions 2012 2011 2010
U.S. federal $1,129.9 $1,173.4 $1,127.1
U.S. state 189.8 165.2 161.1
Outside the U.S. 1,160.0 982.1 841.5
Current tax provision 2,479.7 2,320.7 2,129.7
U.S. federal 144.9 189.0 (66.8)
U.S. state 5.5 8.6 13.8
Outside the U.S. (15.9) (9.2) (22.7)
Deferred tax provision
(benefit) 134.5 188.4 (75.7)
Provision for income taxes $2,614.2 $2,509.1 $2,054.0
Net deferred tax liabilities consisted of:
In millions December 31, 2012 2011
Property and equipment $ 1,713.9 $ 1,651.3
Other 636.4 541.7
Total deferred tax liabilities 2,350.3 2,193.0
Property and equipment (403.6) (355.4)
Employee benefit plans (362.9) (406.3)
Intangible assets (258.0) (256.2)
Deferred foreign tax credits (179.5) (173.9)
Capital loss carryforwards (2.8) (26.0)
Operating loss carryforwards (92.4) (71.1)
Indemnification liabilities (18.3) (33.4)
Other (298.3) (312.6)
Total deferred tax assets
before valuation allowance (1,615.8) (1,634.9)
Valuation Allowance 127.0 102.0
Net deferred tax liabilities 861.5 660.1
Balance sheet presentation:
Deferred income taxes 1,531.1 1,344.1
Other assets-miscellaneous (603.6) (606.3)
Current assets-prepaid expenses
and other current assets (66.0) (77.7)
Net deferred tax liabilities $ 861.5 $ 660.1
The statutory U.S. federal income tax rate reconciles to the
effective income tax rates as follows:
2012 2011 2010
Statutory U.S. federal income tax rate 35.0% 35.0% 35.0%
State income taxes, net of related
federal income tax benefit 1.6 1.4 1.6
Benefits and taxes related to foreign
operations (4.1) (4.7) (6.9)
Other, net (0.1) (0.4) (0.4)
Effective income tax rates 32.4% 31.3% 29.3%
As of December 31, 2012 and 2011, the Company’s gross
unrecognized tax benefits totaled $482.4 million and $565.0 mil-
lion, respectively. After considering the deferred tax accounting
impact, it is expected that about $360 million of the total as of
December 31, 2012 would favorably affect the effective tax rate
if resolved in the Company’s favor.
40 McDonald’s Corporation 2012 Annual Report