McDonalds 2012 Annual Report Download - page 37
Download and view the complete annual report
Please find page 37 of the 2012 McDonalds annual report below. You can navigate through the pages in the report by either clicking on the pages listed below, or by using the keyword search tool below to find specific information within the annual report.-
 1
1 -
2
-
3
-
4
-
5
-
6
-
7
-
8
-
9
-
10
-
11
-
12
-
13
-
14
-
15
-
16
-
17
-
18
-
19
-
20
-
21
-
22
-
23
-
24
-
25
-
26
-
 27
27 -
 28
28 -
 29
29 -
 30
30 -
 31
31 -
 32
32 -
 33
33 -
 34
34 -
 35
35 -
 36
36 -
 37
37 -
 38
38 -
 39
39 -
 40
40 -
 41
41 -
 42
42 -
 43
43 -
 44
44 -
 45
45 -
 46
46 -
 47
47 -
48
-
49
-
50
-
51
-
52
-
53
-
54
 |
 |

model-derived valuations in which all significant inputs are
observable for substantially the full term of the asset or liability.
• Level 3 – inputs to the valuation methodology are
unobservable and significant to the fair value measurement of
the asset or liability.
Certain of the Company’s derivatives are valued using various
pricing models or discounted cash flow analyses that incorporate
observable market parameters, such as interest rate yield curves,
option volatilities and currency rates, classified as Level 2 within
the valuation hierarchy. Derivative valuations incorporate credit
risk adjustments that are necessary to reflect the probability of
default by the counterparty or the Company.
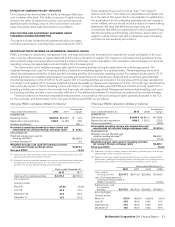
• Certain Financial Assets and Liabilities Measured at
Fair Value
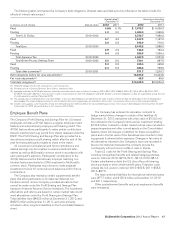
The following tables present financial assets and liabilities meas-
ured at fair value on a recurring basis by the valuation hierarchy
as defined in the fair value guidance:
December 31, 2012
In millions Level 1 Level 2 Level 3 Carrying
Value
Cash equivalents $670.8 $ 670.8
Investments 155.1* 155.1
Derivative assets 132.3* $ 86.1 218.4
Total assets at fair
value $958.2 $ 86.1 $1,044.3
Derivative payables $(42.6) $ (42.6)
Total liabilities at fair
value $(42.6) $ (42.6)
December 31, 2011
In millions Level 1 Level 2 Level 3 Carrying
Value
Cash equivalents $581.7 $ 581.7
Investments 132.4* 132.4
Derivative assets 154.5* $ 71.1 225.6
Total assets at fair
value $868.6 $ 71.1 $ 939.7
Derivative payables $(15.6) $ (15.6)
Total liabilities at fair
value $(15.6) $ (15.6)
* Includes investments and derivatives that hedge market driven changes in liabilities
associated with the Company’s supplemental benefit plan.
• Non-Financial Assets and Liabilities Measured at Fair
Value on a Nonrecurring Basis
Certain assets and liabilities are measured at fair value on a
nonrecurring basis; that is, the assets and liabilities are not
measured at fair value on an ongoing basis, but are subject to fair
value adjustments in certain circumstances (e.g., when there is
evidence of impairment). For the year ended December 31,
2012, no material fair value adjustments or fair value measure-
ments were required for non-financial assets or liabilities.
• Certain Financial Assets and Liabilities not Measured
at Fair Value
At December 31, 2012, the fair value of the Company’s debt
obligations was estimated at $15.6 billion, compared to a carry-
ing amount of $13.6 billion. The fair value was based on quoted
market prices, Level 2 within the valuation hierarchy. The carrying
amount for both cash equivalents and notes receivable approx-
imate fair value.
FINANCIAL INSTRUMENTS AND HEDGING ACTIVITIES
The Company is exposed to global market risks, including the
effect of changes in interest rates and foreign currency fluctua-
tions. The Company uses foreign currency denominated debt and
derivative instruments to mitigate the impact of these changes.
The Company does not use derivatives with a level of complexity
or with a risk higher than the exposures to be hedged and does
not hold or issue derivatives for trading purposes.
The Company documents its risk management objective and
strategy for undertaking hedging transactions, as well as all rela-
tionships between hedging instruments and hedged items. The
Company’s derivatives that are designated as hedging instru-
ments consist mainly of interest rate swaps, foreign currency
forwards and foreign currency options, cross-currency swaps,
and commodity forwards, further explained in the “Fair Value,”
“Cash Flow” and “Net Investment” hedge sections.
The Company also enters into certain derivatives that are not
designated as hedging instruments. The Company has entered
into equity derivative contracts to hedge market-driven changes
in certain of its supplemental benefit plan liabilities. Changes in
the fair value of these derivatives are recorded in Selling, gen-
eral & administrative expenses together with the changes in the
supplemental benefit plan liabilities. In addition, the Company
uses foreign currency forwards to mitigate the change in fair
value of certain foreign currency denominated assets and
liabilities. Since these derivatives are not designated for hedge
accounting, the changes in the fair value of these derivatives are
recognized immediately in nonoperating (income) expense
together with the currency gain or loss from the hedged balance
sheet position. A portion of the Company’s foreign currency
options (more fully described in the “Cash Flow Hedges” section)
are undesignated as hedging instruments as the underlying for-
eign currency royalties are earned.
All derivative instruments designated as hedging instruments
are classified as fair value, cash flow or net investment hedges.
All derivatives (including those not designated for hedge
accounting) are recognized on the Consolidated balance sheet at
fair value and classified based on the instruments’ maturity dates.
Changes in the fair value measurements of the derivative instru-
ments are reflected as adjustments to other comprehensive
income (“OCI”) and/or current earnings.
McDonald’s Corporation 2012 Annual Report 35