McDonalds 2012 Annual Report Download - page 29
Download and view the complete annual report
Please find page 29 of the 2012 McDonalds annual report below. You can navigate through the pages in the report by either clicking on the pages listed below, or by using the keyword search tool below to find specific information within the annual report.-
 1
1 -
2
-
3
-
4
-
5
-
6
-
7
-
8
-
9
-
10
-
11
-
12
-
13
-
14
-
15
-
16
-
17
-
18
-
 19
19 -
 20
20 -
 21
21 -
 22
22 -
 23
23 -
 24
24 -
 25
25 -
 26
26 -
 27
27 -
 28
28 -
 29
29 -
 30
30 -
 31
31 -
 32
32 -
 33
33 -
 34
34 -
 35
35 -
 36
36 -
 37
37 -
 38
38 -
 39
39 -
40
-
41
-
42
-
43
-
44
-
45
-
46
-
47
-
48
-
49
-
50
-
51
-
52
-
53
-
54
 |
 |

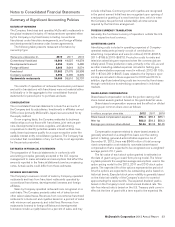
EFFECTS OF CHANGING PRICES—INFLATION
The Company has demonstrated an ability to manage inflationary
cost increases effectively. This ability is because of rapid inventory
turnover, the ability to adjust menu prices, cost controls and sub-
stantial property holdings, many of which are at fixed costs and
partly financed by debt made less expensive by inflation.
RISK FACTORS AND CAUTIONARY STATEMENT ABOUT
FORWARD-LOOKING INFORMATION
This report includes forward-looking statements about our plans
and future performance, including those under Outlook for 2013.
These statements use such words as “may,” “will,” “expect,”
“believe” and “plan.” They reflect our expectations and speak only
as of the date of this report. We do not undertake to update them.
Our expectations (or the underlying assumptions) may change or
not be realized, and you should not rely unduly on forward-looking
statements. We have identified the principal risks and
uncertainties that affect our performance in the Company’s filings
with the Securities and Exchange Commission, and investors are
urged to consider these risks and uncertainties when evaluating
our historical and expected performance.
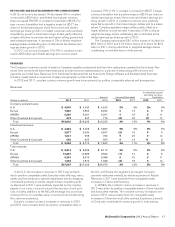
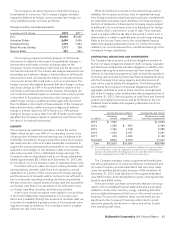
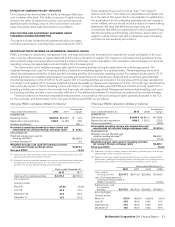
RECONCILIATION OF RETURNS ON INCREMENTAL INVESTED CAPITAL
ROIIC is a measure reviewed by management over one-year and three-year time periods to evaluate the overall profitability of the busi-
ness units, the effectiveness of capital deployed and the future allocation of capital. This measure is calculated using operating income
and constant foreign exchange rates to exclude the impact of foreign currency translation. The numerator is the Company’s incremental
operating income plus depreciation and amortization from the base period.
The denominator is the weighted-average cash used for investing activities during the applicable one-or three-year period. The
weighted-average cash used for investing activities is based on a weighting applied on a quarterly basis. These weightings are used to
reflect the estimated contribution of each quarter’s investing activities to incremental operating income. For example, fourth quarter 2012
investing activities are weighted less because the assets purchased have only recently been deployed and would have generated little
incremental operating income (12.5% of fourth quarter 2012 investing activities are included in the one-year and three-year calculations).
In contrast, fourth quarter 2011 is heavily weighted because the assets purchased were deployed more than 12 months ago, and therefore
have a full-year impact on 2012 operating income, with little or no impact to the base period (87.5% and 100.0% of fourth quarter 2011
investing activities are included in the one-year and three-year calculations, respectively). Management believes that weighting cash used
for investing activities provides a more accurate reflection of the relationship between its investments and returns than a simple average.
The reconciliations to the most comparable measurements, in accordance with accounting principles generally accepted in the U.S.,
for the numerator and denominator of the one-year and three-year ROIIC are as follows:
One-year ROIIC calculation (dollars in millions):
Years ended December 31, 2012 2011 Incremental
change
NUMERATOR:
Operating income $8,604.6 $8,529.7 $ 74.9
Depreciation and amortization 1,488.5 1,415.0 73.5
Currency translation(1) 286.1
Incremental operating income plus depreciation and
amortization (at constant foreign exchange rates) $ 434.5
DENOMINATOR:
Weighted-average cash used for
investing activities(2) $2,826.3
Currency translation(1) 3.0
Weighted-average cash used for investing activities
(at constant foreign exchange rates) $2,829.3
One-year ROIIC 15.4%
(1) Represents the effect of foreign currency translation by translating results at an aver-
age exchange rate for the periods measured.
(2) Represents one-year weighted-average cash used for investing activities, determined
by applying the weightings below to the cash used for investing activities for each
quarter in the two-year period ended December 31, 2012.
Years ended December 31,
2012 2011
Cash used for investing activities $3,167.3 $2,570.9
AS A PERCENT
Quarters ended:
March 31 87.5% 12.5%
June 30 62.5 37.5
September 30 37.5 62.5
December 31 12.5 87.5
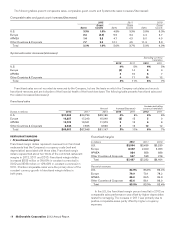
Three-year ROIIC calculation (dollars in millions):
Years ended December 31, 2012 2009 Incremental
change
NUMERATOR:
Operating income $8,604.6 $6,841.0 $1,763.6
Depreciation and amortization 1,488.5 1,216.2 272.3
Currency translation(3) (65.3)
Incremental operating income plus depreciation and
amortization (at constant foreign exchange rates) $1,970.6
DENOMINATOR:
Weighted-average adjusted cash
used for investing activities(4) $6,959.1
Currency translation(3) (70.0)
Weighted-average cash used for investing activities
(at constant foreign exchange rates) $6,889.1
Three-year ROIIC 28.6%
(3) Represents the effect of foreign currency translation by translating results at an aver-
age exchange rate for the periods measured.
(4) Represents three-year weighted-average adjusted cash used for investing activities,
determined by applying the weightings below to the adjusted cash used for investing
activities for each quarter in the four-year period ended December 31, 2012.
Years ended December 31,
2012 2011 2010 2009
Cash used for
investing activities $3,167.3 $2,570.9 $2,056.0 $1,655.3
Less: Cash generated from
investing activities related to
Redbox transaction (144.9)
Adjusted cash used
for investing
activities $3,167.3 $2,570.9 $2,056.0 $1,800.2
AS A PERCENT
Quarters ended:
March 31 87.5% 100.0% 100.0% 12.5%
June 30 62.5 100.0 100.0 37.5
September 30 37.5 100.0 100.0 62.5
December 31 12.5 100.0 100.0 87.5
McDonald’s Corporation 2012 Annual Report 27