McDonalds 2012 Annual Report Download - page 19
Download and view the complete annual report
Please find page 19 of the 2012 McDonalds annual report below. You can navigate through the pages in the report by either clicking on the pages listed below, or by using the keyword search tool below to find specific information within the annual report.-
 1
1 -
2
-
3
-
4
-
5
-
6
-
7
-
8
-
 9
9 -
 10
10 -
 11
11 -
 12
12 -
 13
13 -
 14
14 -
 15
15 -
 16
16 -
 17
17 -
 18
18 -
 19
19 -
 20
20 -
 21
21 -
 22
22 -
 23
23 -
 24
24 -
 25
25 -
 26
26 -
 27
27 -
 28
28 -
 29
29 -
30
-
31
-
32
-
33
-
34
-
35
-
36
-
37
-
38
-
39
-
40
-
41
-
42
-
43
-
44
-
45
-
46
-
47
-
48
-
49
-
50
-
51
-
52
-
53
-
54
 |
 |

NET INCOME AND DILUTED EARNINGS PER COMMON SHARE
In 2012, net income decreased 1% (increased 3% in constant
currencies) to $5.5 billion and diluted earnings per common
share increased 2% (5% in constant currencies) to $5.36. For-
eign currency translation had a negative impact of $0.17 per
share on diluted earnings per share. Net income and diluted
earnings per share growth in constant currencies were positively
impacted by growth in franchised margin dollars, partly offset by
a higher effective income tax rate and higher selling, general and
administrative expenses. A decrease of 2% in diluted weighted
average shares outstanding also contributed to the diluted earn-
ings per share growth in 2012.
In 2011, net income increased 11% (7% in constant curren-
cies) to $5.5 billion and diluted earnings per common share
increased 15% (11% in constant currencies) to $5.27. Foreign
currency translation had a positive impact of $0.19 per share on
diluted earnings per share. Net income and diluted earnings per
share growth in 2011 in constant currencies were positively
impacted by growth in franchised margin dollars, and to a lesser
extent, Company-operated margin dollars, partly offset by a
higher effective income tax rate. A decrease of 3% in diluted
weighted average shares outstanding also contributed to the
diluted earnings per share growth in 2011.
The Company repurchased 28.1 million shares of its stock for
$2.6 billion in 2012 and 41.9 million shares of its stock for $3.4
billion in 2011, driving reductions in weighted average shares
outstanding on a diluted basis in both periods.
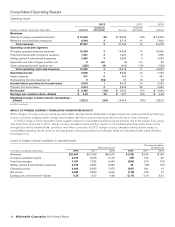
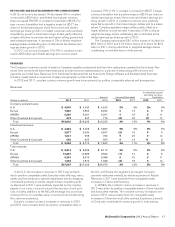
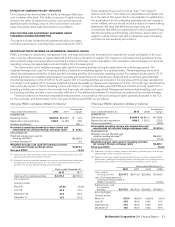
REVENUES
The Company’s revenues consist of sales by Company-operated restaurants and fees from restaurants operated by franchisees. Rev-
enues from conventional franchised restaurants include rent and royalties based on a percent of sales along with minimum rent
payments, and initial fees. Revenues from franchised restaurants that are licensed to foreign affiliates and developmental licensees
include a royalty based on a percent of sales, and generally include initial fees.
In 2012 and 2011, constant currency revenue growth was driven primarily by positive comparable sales as well as expansion.
Revenues
Amount Increase/(decrease)
Increase/(decrease)
excluding currency
translation
Dollars in millions 2012 2011 2010 2012 2011 2012 2011
Company-operated sales:
U.S. $ 4,530 $ 4,433 $ 4,229 2% 5% 2% 5%
Europe 7,850 7,852 6,932 013 68
APMEA 5,350 5,061 4,297 618 511
Other Countries & Corporate 873 947 775 (8) 22 (7) 17
Total $18,603 $18,293 $16,233 2% 13% 4% 8%
Franchised revenues:
U.S. $ 4,284 $ 4,096 $ 3,883 5% 5% 5% 5%
Europe 2,977 3,034 2,637 (2) 15 59
APMEA 1,041 958 769 925 914
Other Countries & Corporate 662 625 553 613 11 8
Total $ 8,964 $ 8,713 $ 7,842 3% 11% 6% 8%
Total revenues:
U.S. $ 8,814 $ 8,529 $ 8,112 3% 5% 3% 5%
Europe 10,827 10,886 9,569 (1) 14 68
APMEA 6,391 6,019 5,066 619 611
Other Countries & Corporate 1,535 1,572 1,328 (2) 18 014
Total $27,567 $27,006 $24,075 2% 12% 5% 8%
In the U.S., the increase in revenues in 2012 was primarily
due to positive comparable sales. Everyday value offerings, menu
variety and the enhanced customer experience due to reimaging
contributed positively to results, despite broad competitive activ-
ity. Revenues in 2011 were positively impacted by the ongoing
appeal of our iconic core products and the success of new prod-
ucts, including additions to the McCafé beverage line, as well as
continued focus on everyday value, convenience and modernizing
the customer experience.
Europe’s constant currency increases in revenues in 2012
and 2011 were primarily driven by positive comparable sales in
the U.K. and Russia, the segment’s two largest Company-
operated restaurant markets, as well as expansion in Russia.
Revenues in 2011 also benefited from comparable sales
increases in France and Germany.
In APMEA, the constant currency increase in revenues in
2012 was driven by positive comparable sales in China, Australia
and many other markets. The constant currency increase in rev-
enues in 2011 was primarily driven by comparable sales
increases in China and most other markets. Expansion, primarily
in China, also contributed to revenue growth in both periods.
McDonald’s Corporation 2012 Annual Report 17