McDonalds 2012 Annual Report Download - page 25
Download and view the complete annual report
Please find page 25 of the 2012 McDonalds annual report below. You can navigate through the pages in the report by either clicking on the pages listed below, or by using the keyword search tool below to find specific information within the annual report.-
 1
1 -
2
-
3
-
4
-
5
-
6
-
7
-
8
-
9
-
10
-
11
-
12
-
13
-
14
-
 15
15 -
 16
16 -
 17
17 -
 18
18 -
 19
19 -
 20
20 -
 21
21 -
 22
22 -
 23
23 -
 24
24 -
 25
25 -
 26
26 -
 27
27 -
 28
28 -
 29
29 -
 30
30 -
 31
31 -
 32
32 -
 33
33 -
 34
34 -
 35
35 -
36
-
37
-
38
-
39
-
40
-
41
-
42
-
43
-
44
-
45
-
46
-
47
-
48
-
49
-
50
-
51
-
52
-
53
-
54
 |
 |

on hand and cash provided by operations, the Company can meet
short-term funding needs through its continued access to com-
mercial paper borrowings and line of credit agreements.
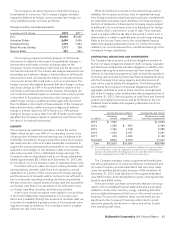
RESTAURANT DEVELOPMENT AND CAPITAL EXPENDITURES
In 2012, the Company opened 1,404 traditional restaurants and
35 satellite restaurants (small, limited-menu restaurants for which
the land and building are generally leased), and closed 269 tradi-
tional restaurants and 200 satellite restaurants. In 2011, the
Company opened 1,118 traditional restaurants and 32 satellite
restaurants, and closed 246 traditional restaurants and 131
satellite restaurants. The majority of restaurant openings and
closings occurred in the major markets in both years. The Com-
pany closes restaurants for a variety of reasons, such as existing
sales and profit performance or loss of real estate tenure.
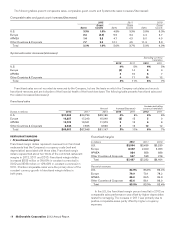
Systemwide restaurants at year end(1)
2012 2011 2010
U.S. 14,157 14,098 14,027
Europe 7,368 7,156 6,969
APMEA 9,454 8,865 8,424
Other Countries & Corporate 3,501 3,391 3,317
Total 34,480 33,510 32,737
(1) Includes satellite units at December 31, 2012, 2011 and 2010 as follows: U.S.—
997, 1,084, 1,112; Europe—246, 240, 239; APMEA (primarily Japan)—871, 949,
1,010; Other Countries & Corporate—453, 459, 470.
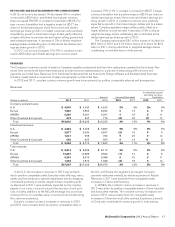
Approximately 65% of Company-operated restaurants and
over 75% of franchised restaurants were located in the major
markets at the end of 2012. Over 80% of the restaurants at
year-end 2012 were franchised.
Capital expenditures increased $319 million or 12% in 2012,
and increased $595 million or 28% in 2011, primarily due to
higher reinvestment in existing restaurants and higher investment
in new restaurants. The higher reinvestment reflects the Compa-
ny’s commitment to grow sales through initiatives such as
reimaging in many markets around the world. The increase
related to new restaurants reflects our commitment to broaden
accessibility to our brand.
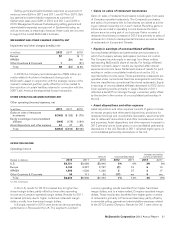
Capital expenditures invested in major markets, excluding
Japan, represented about 70% of the total in 2012, 2011 and
2010. Japan is accounted for under the equity method, and
accordingly its capital expenditures are not included in con-
solidated amounts.
Capital expenditures
In millions 2012 2011 2010
New restaurants $ 1,340 $ 1,193 $ 968
Existing restaurants 1,615 1,432 1,089
Other(1) 94 105 78
Total capital expenditures $ 3,049 $ 2,730 $ 2,135
Total assets $35,386 $32,990 $31,975
(1) Primarily corporate equipment and other office-related expenditures.
New restaurant investments in all years were concentrated in
markets with acceptable returns or opportunities for long-term
growth. Average development costs vary widely by market
depending on the types of restaurants built and the real estate
and construction costs within each market. These costs, which
include land, buildings and equipment, are managed through the
use of optimally-sized restaurants, construction and design effi-
ciencies, and leveraging best practices. Although the Company is
not responsible for all costs for every restaurant opened, total
development costs (consisting of land, buildings and equipment)
for new traditional McDonald’s restaurants in the U.S. averaged
approximately $2.9 million in 2012.
The Company owned approximately 45% of the land and
about 70% of the buildings for restaurants in its consolidated
markets at year-end 2012 and 2011.
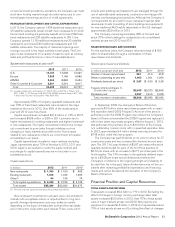
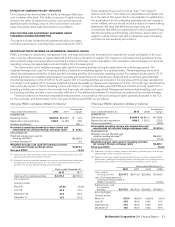
SHARE REPURCHASES AND DIVIDENDS
For the last three years, the Company returned a total of $16.5
billion to shareholders through a combination of share
repurchases and dividends.
Shares repurchased and dividends
In millions, except per share data 2012 2011 2010
Number of shares repurchased 28.1 41.9 37.8
Shares outstanding at year end 1,003 1,021 1,054
Dividends declared per share $ 2.87 $ 2.53 $ 2.26
Treasury stock purchases (in
Shareholders’ equity) $2,605 $3,373 $2,648
Dividends paid 2,897 2,610 2,408
Total returned to shareholders $5,502 $5,983 $5,056
In September 2009, the Company’s Board of Directors
approved a $10 billion share repurchase program with no speci-
fied expiration date (“2009 Program”). As most of the amount
authorized under the 2009 Program was utilized, the Company’s
Board of Directors terminated the 2009 Program and replaced it
with a new share repurchase program, effective August 1, 2012,
that authorizes the purchase of up to $10 billion of the Compa-
ny’s outstanding common stock with no specified expiration date.
In 2012, approximately 8.4 million shares were repurchased for
$748 million under the new program.
The Company has paid dividends on its common stock for 37
consecutive years and has increased the dividend amount every
year. The 2012 full year dividend of $2.87 per share reflects the
quarterly dividend paid for each of the first three quarters of
$0.70 per share, with an increase to $0.77 per share paid in the
fourth quarter. This 10% increase in the quarterly dividend equa-
tes to a $3.08 per share annual dividend and reflects the
Company’s confidence in the ongoing strength and reliability of
its cash flow. As in the past, future dividend amounts will be con-
sidered after reviewing profitability expectations and financing
needs, and will be declared at the discretion of the Company’s
Board of Directors.
Financial Position and Capital Resources
TOTAL ASSETS AND RETURNS
Total assets increased $2.4 billion or 7% in 2012. Excluding the
effect of changes in foreign currency exchange rates, total
assets increased $2.0 billion in 2012. Over 75% of total assets
were in major markets at year-end 2012. Net property and
equipment increased $1.8 billion in 2012 and represented about
70% of total assets at year end. Excluding the effect of changes
McDonald’s Corporation 2012 Annual Report 23